Set Up A Personalized Dashboard
Learn how to setup your personal dashboard with AssetLoom
AssetLoom offers you a wide range of widgets to customize your personalized dashboard. With this dashboard, you can quickly check important updates, spot issues earlier, and make better decisions without searching through different screens.
The Dashboard is located under the Getting Started section on the left-hand side menu sidebar.
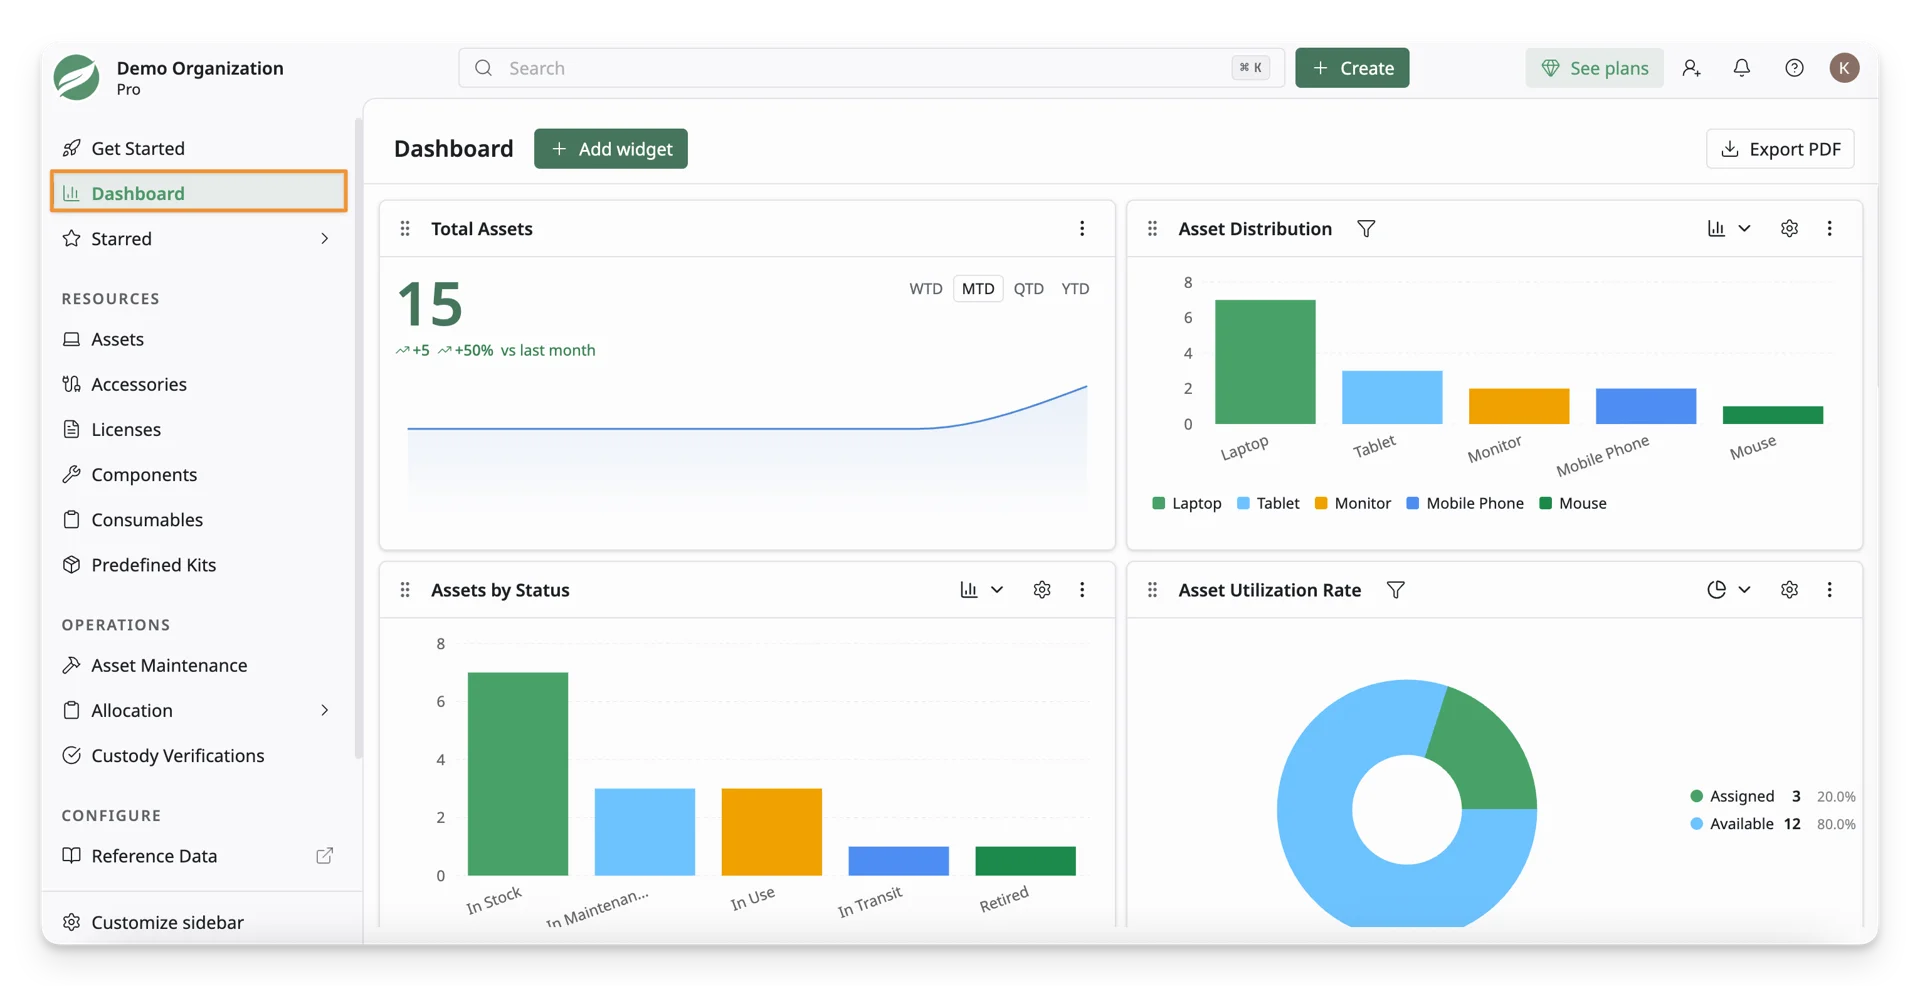
Each user has a personal dashboard. Your customizations and changes affect only your dashboard.
1. Add Widgets To Your Dashboard
To add a widget to your dashboard, follow these steps:
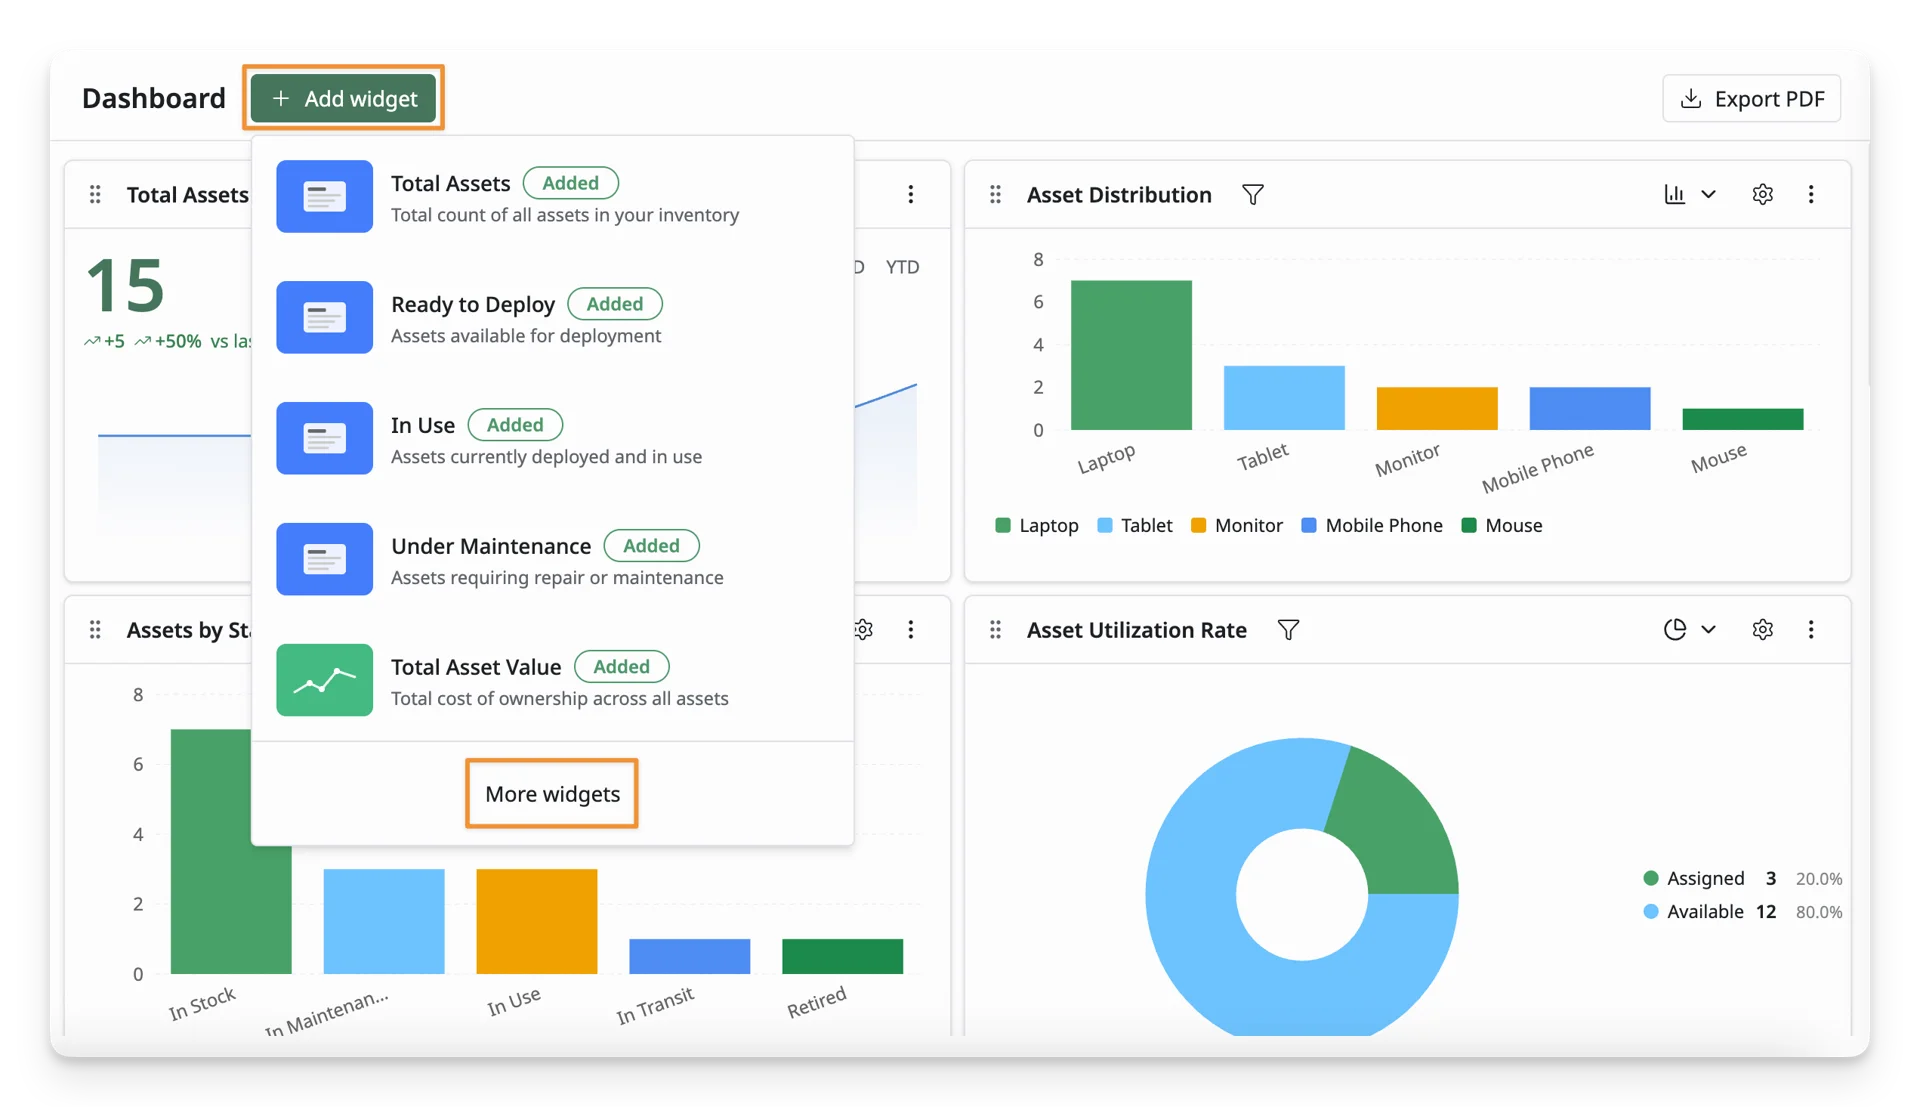
- Click on the “Add widget” button. Then click on the “More widgets” button.
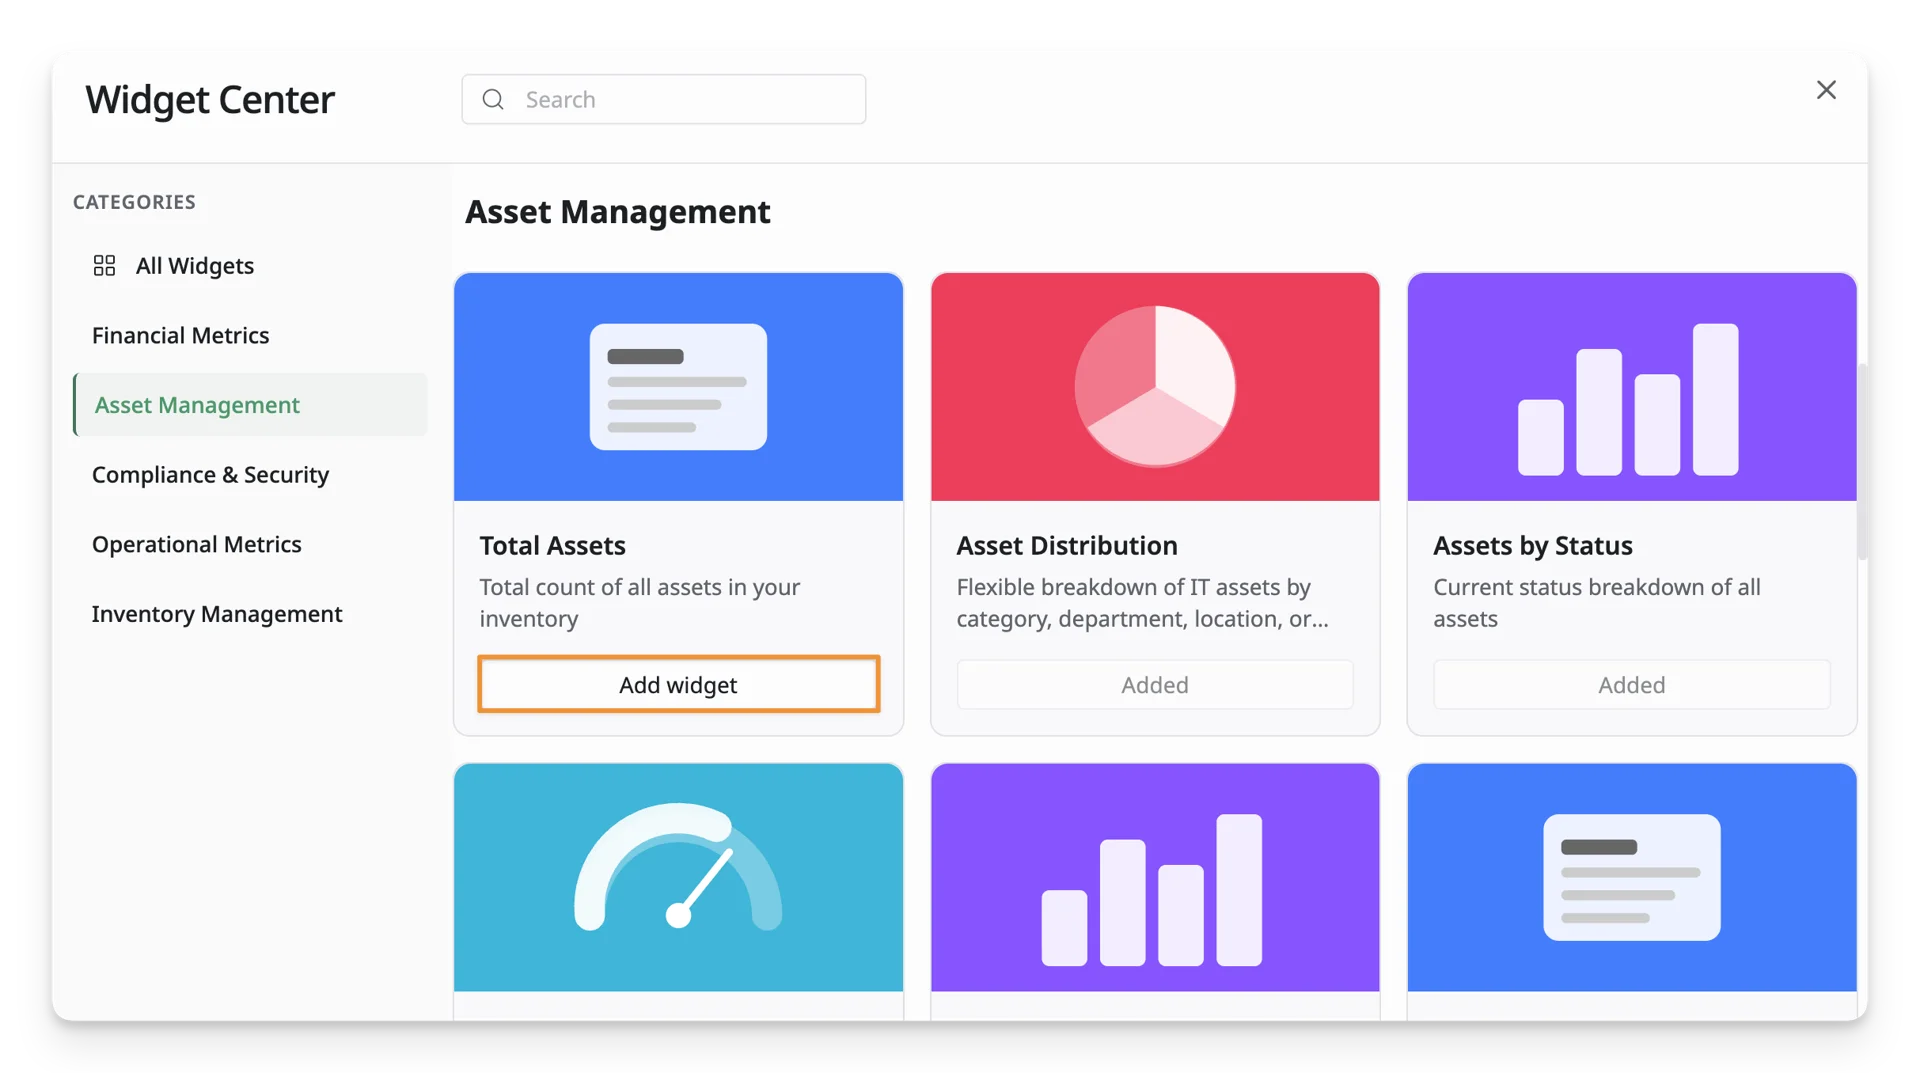
- You can see all AssetLoom widgets in the Widget Center. Select the one you want to use and click “Add”.
Learn more about AssetLoom’s Types of Widgets.
2. Edit Your Widgets
After adding widgets to your dashboard, you can manage them using the available actions below. These actions help you adjust how widgets appear, what data they show, and whether they remain on your dashboard.
Change Display Format
Some widgets allow you to switch between different display formats for better viewing and analysis. You can choose the format that makes the data easiest to understand.
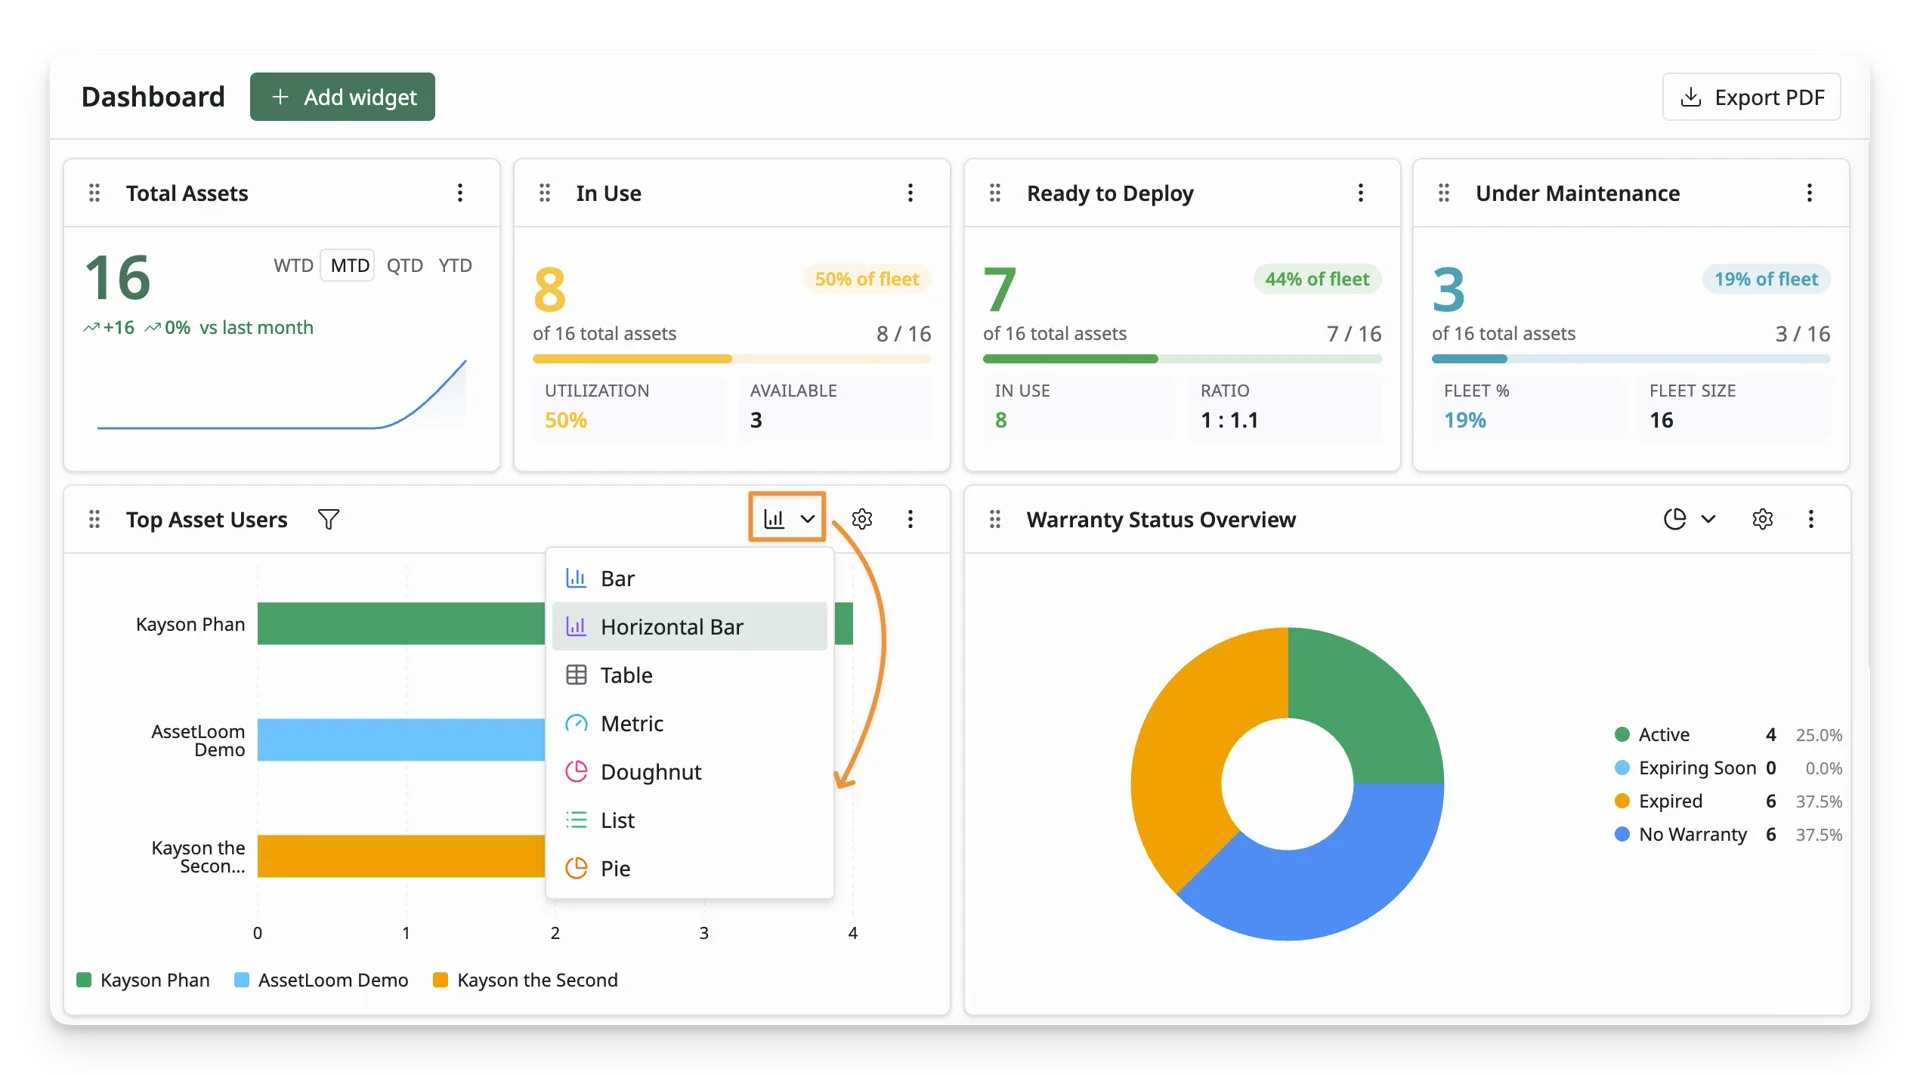
Below are some available widget formats that AssetLoom supports:
| Chart Type | Description | When to Use |
|---|---|---|
| Bar | Compares values across different groups using vertical bars. | Use when you need to compare a small number of categories side by side. |
| Horizontal Bar | Compares values across groups using horizontal bars. | Use when category names are long or when there are many items to compare. |
| Stacked Bar | Compares total values while showing how each total is divided into smaller parts. | Use when you need to compare both totals and the parts that make up each total. |
| Metric | Highlights one important number in a simple, focused view. | Use when you want to check a key number quickly. |
| Doughnut | Shows how a total is divided into different parts using a ring-style chart. | Use when you want to understand how each part contributes to a whole. |
| List | Shows data as a simple list for quick scanning. | Use when you need to review multiple items quickly. |
| Funnel | Shows how items move through a sequence of stages, with each stage narrowing as the count decreases. | Use when you need to track progress through a step-by-step process. |
| Table | Shows detailed data in rows and columns. | Use when you need to review structured details and compare multiple fields. |
| Pie | Shows how a total is split into different parts using a circular chart. | Use when you need a simple part-to-whole view with only a few groups. |
| Breakdown | Shows a summary of data grouped by category, status, user, or another field. | Use when you want to understand how data is grouped or distributed. |
| Line | Shows changes or trends over time. | Use when you need to track how a value changes over a period of time. |
| Area | Shows trends over time with filled areas to highlight volume or growth. | Use when you want to show both the trend and the overall amount over time. |
Here is the summary of widget types available for each chart
| Chart | Chart Format |
|---|---|
| Total Asset Value | Bar, Line, Area |
| Total Assets | Metric |
| Asset Distribution | Bar, List, Pie |
| Assets by Status | Bar, List, Pie |
| Asset Age Analysis | Bar, Metric, Doughnut, List |
| Top Asset Users | Bar, Horizontal Bar, List, Pie |
| Asset Utilization Rate | Bar, Metric, Doughnut |
| Warranty Status Overview | Bar, List, Breakdown, Pie |
| License Expiration Tracker | Bar, Stacked Bar, Metric, List |
| Ready to Deploy | Metric |
| In Use | Metric |
| Under Maintenance | Metric |
| Low Stock Alerts | Bar, Horizontal Bar, List |
You can also expand a widget by dragging its edges or corners. This helps you adjust the widget size and make more space for detailed data.
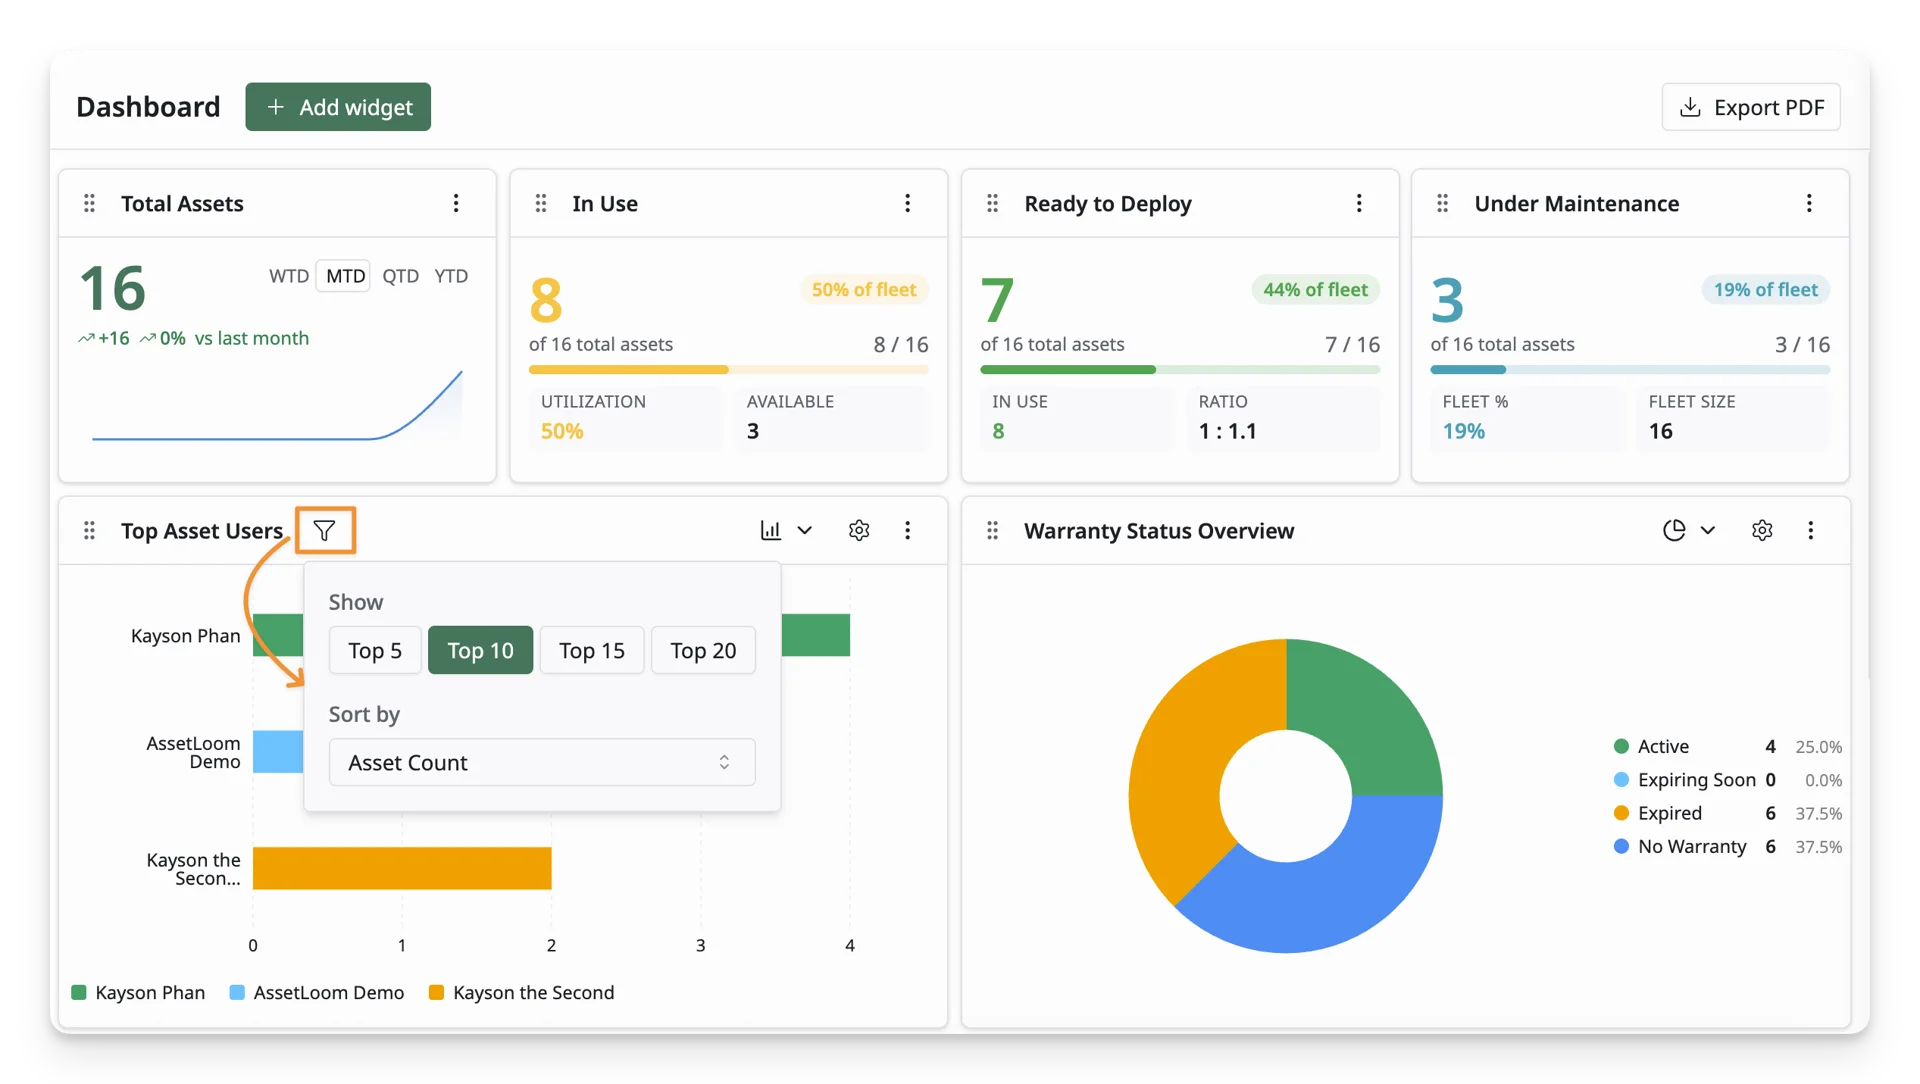
Change Display Data
Some widgets allow you to filter how the data is displayed, so you can focus on the information that matters most. You can narrow down results by specific conditions, time ranges, categories, statuses, or other available fields.
Configure Widget Setting
AssetLoom supports you in configuring how a widget looks and updates on your dashboard. Depending on the widget type, you can customize:
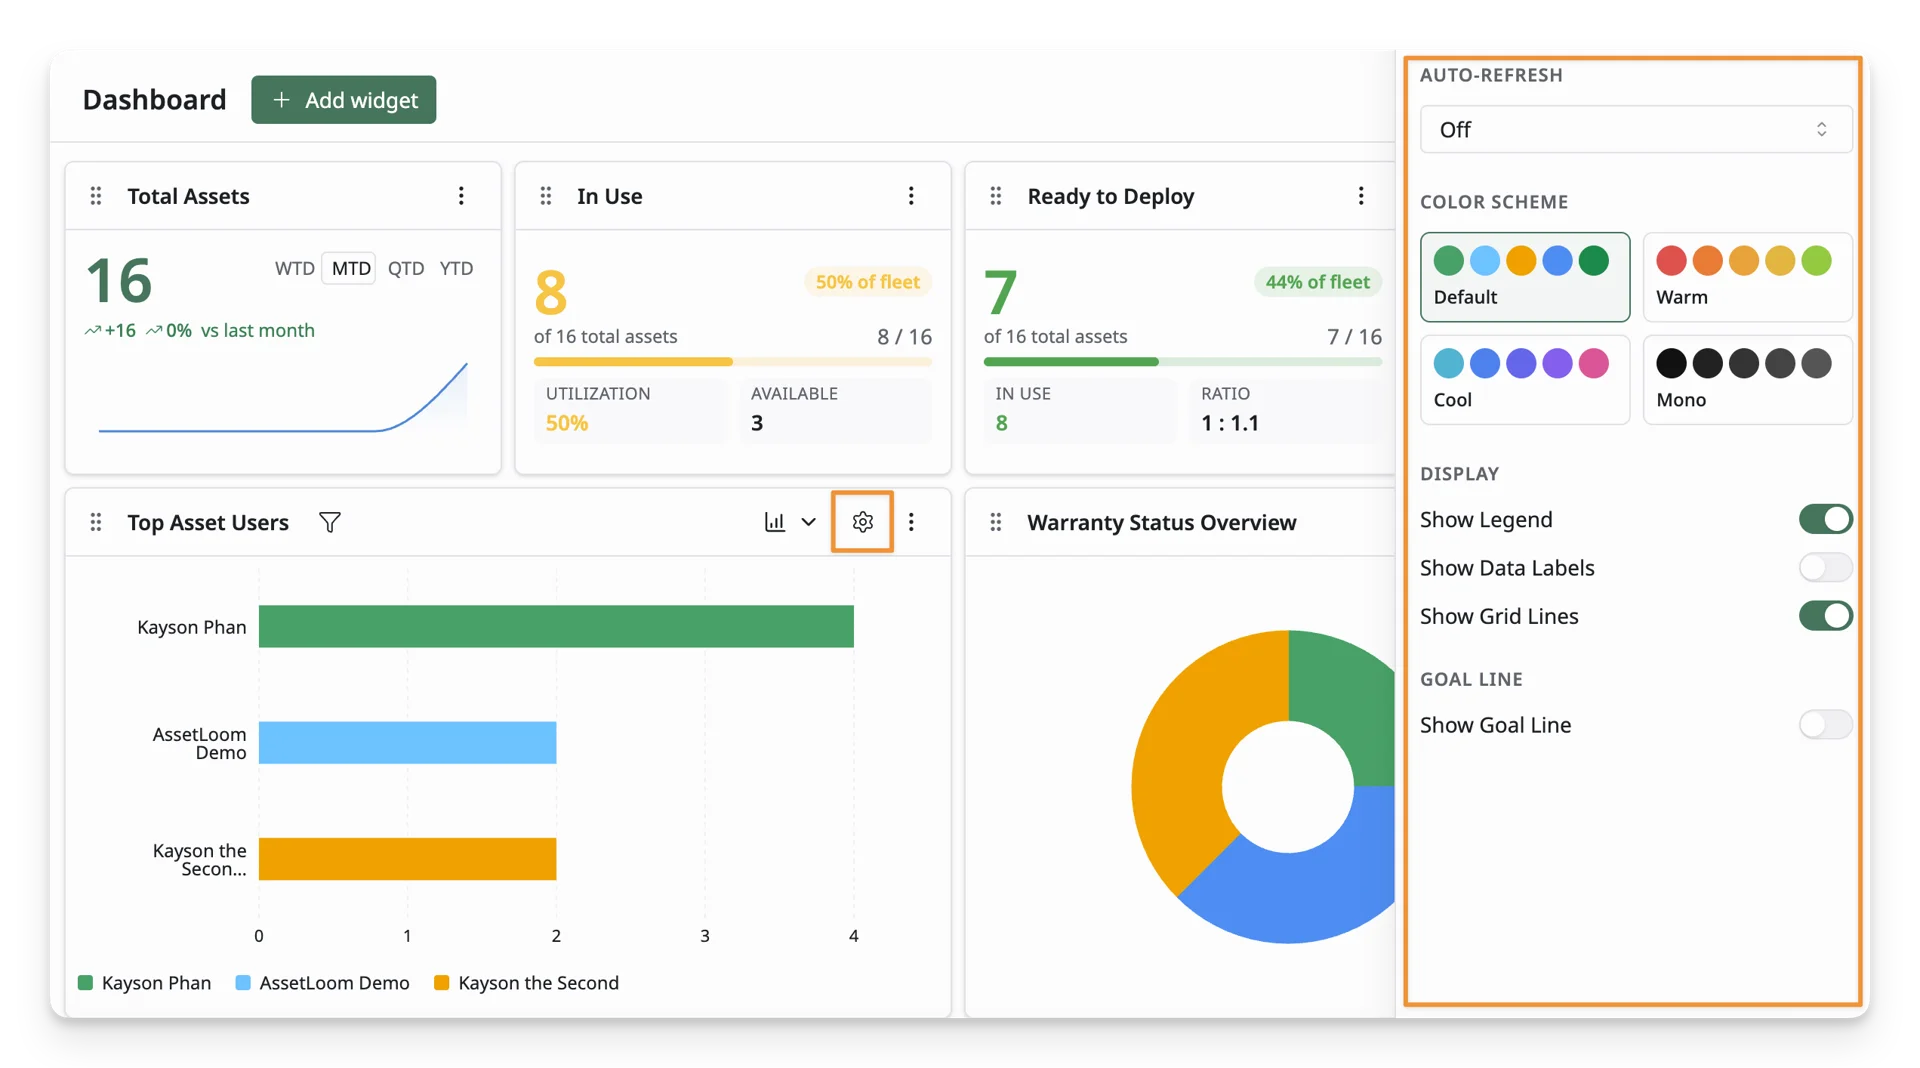
- Auto-refresh: Choose how often the widget updates automatically.
- Color scheme: Select a color style for the widget chart
- Display: Choose what chart details are shown, such as legends, data labels, or grid lines.
- Axis: Customize the X-axis and Y-axis labels, or set minimum and maximum values for the chart scale.
- Goal line: Add a reference line to compare the current data against a target or expected value.
Move & Resize Widget
You can drag and drop widgets to rearrange your dashboard layout. This helps you customize the structure of your dashboard and keep the most important information easy to see.
You can also expand a widget by dragging its edges or corners. This helps you adjust the widget size and make more space for detailed data.
3. Export Your Dashboard
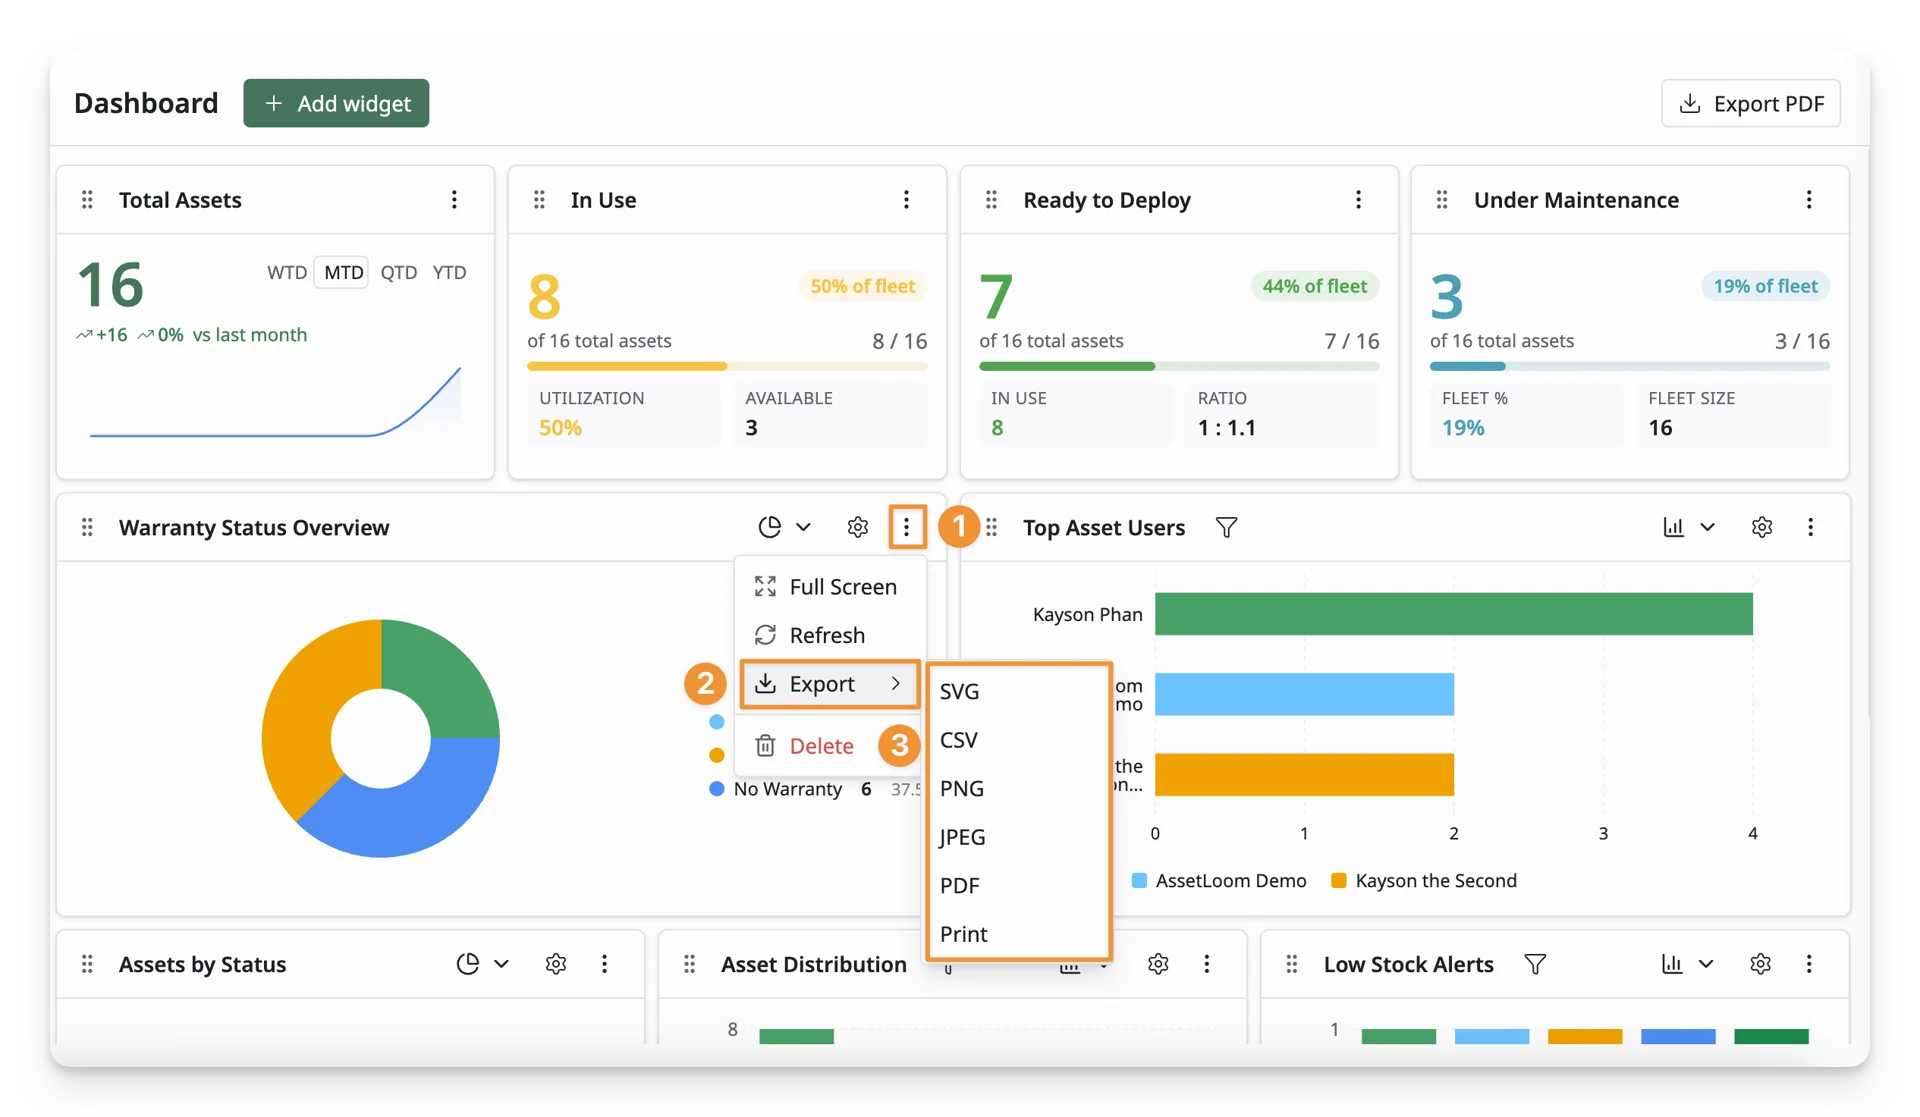
After setting up your dashboard, you can export it for sharing, reporting, or offline review. AssetLoom allows you to export either a single widget or the entire dashboard.
To export a widget:
- Click the 3-dot icon in the top-right corner of the widget.
- Select Export.
- Choose your preferred file type: SVG, CSV, PNG, JPEG, PDF, or Print.
To export the whole dashboard as a PDF:
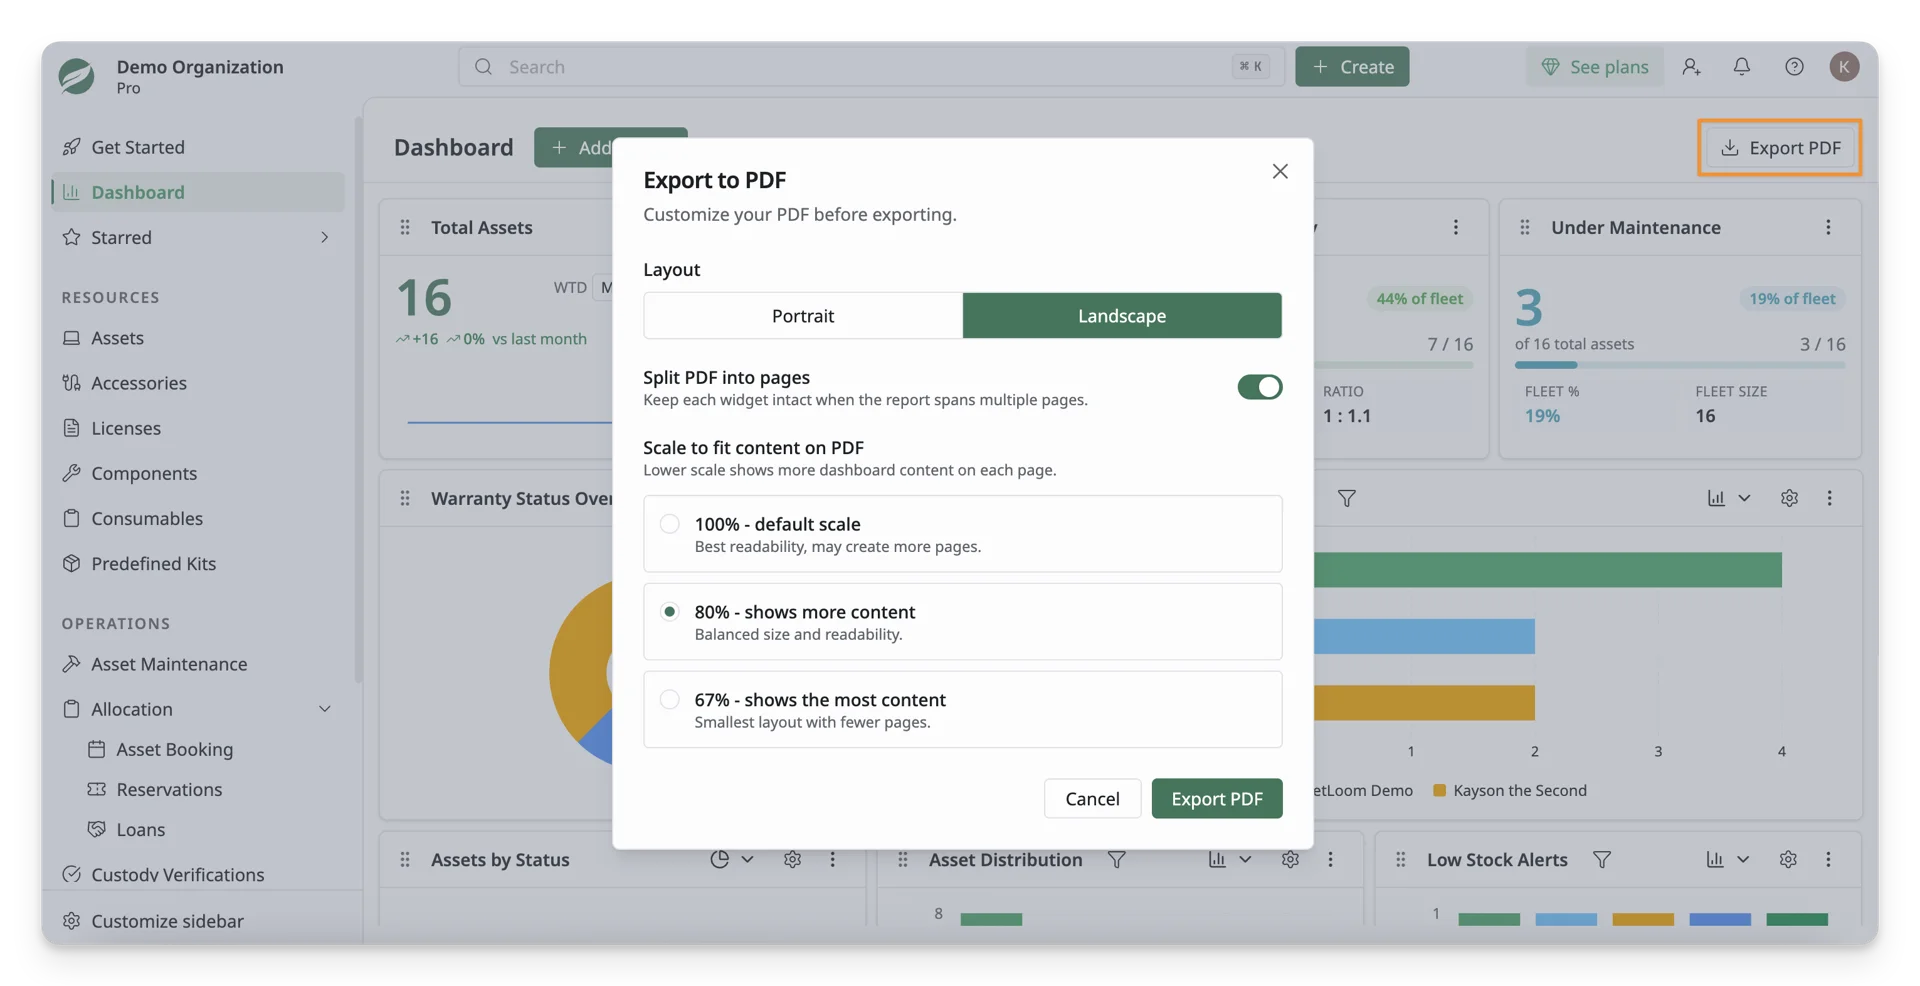
- Click Export PDF at the top of the dashboard.
- Choose the PDF layout: Portrait or Landscape.
- Turn Split PDF into pages on or off to control whether each widget stays together when the dashboard spans multiple pages.
- Choose the scale:
- 100% for the best readability.
- 80% for a balance between readability and showing more content.
- 67% to fit the most dashboard content with fewer pages.
- Click Export PDF to download the dashboard report.