Create a Custom Report
Learn how to create a custom report with AssetLoom
AssetLoom provides multiple preset report templates for common use cases, such as assets by status, licenses expiring soon, or low-stock consumables. You can start with a template or build a report from scratch using your own dataset, filters, and visibility settings.
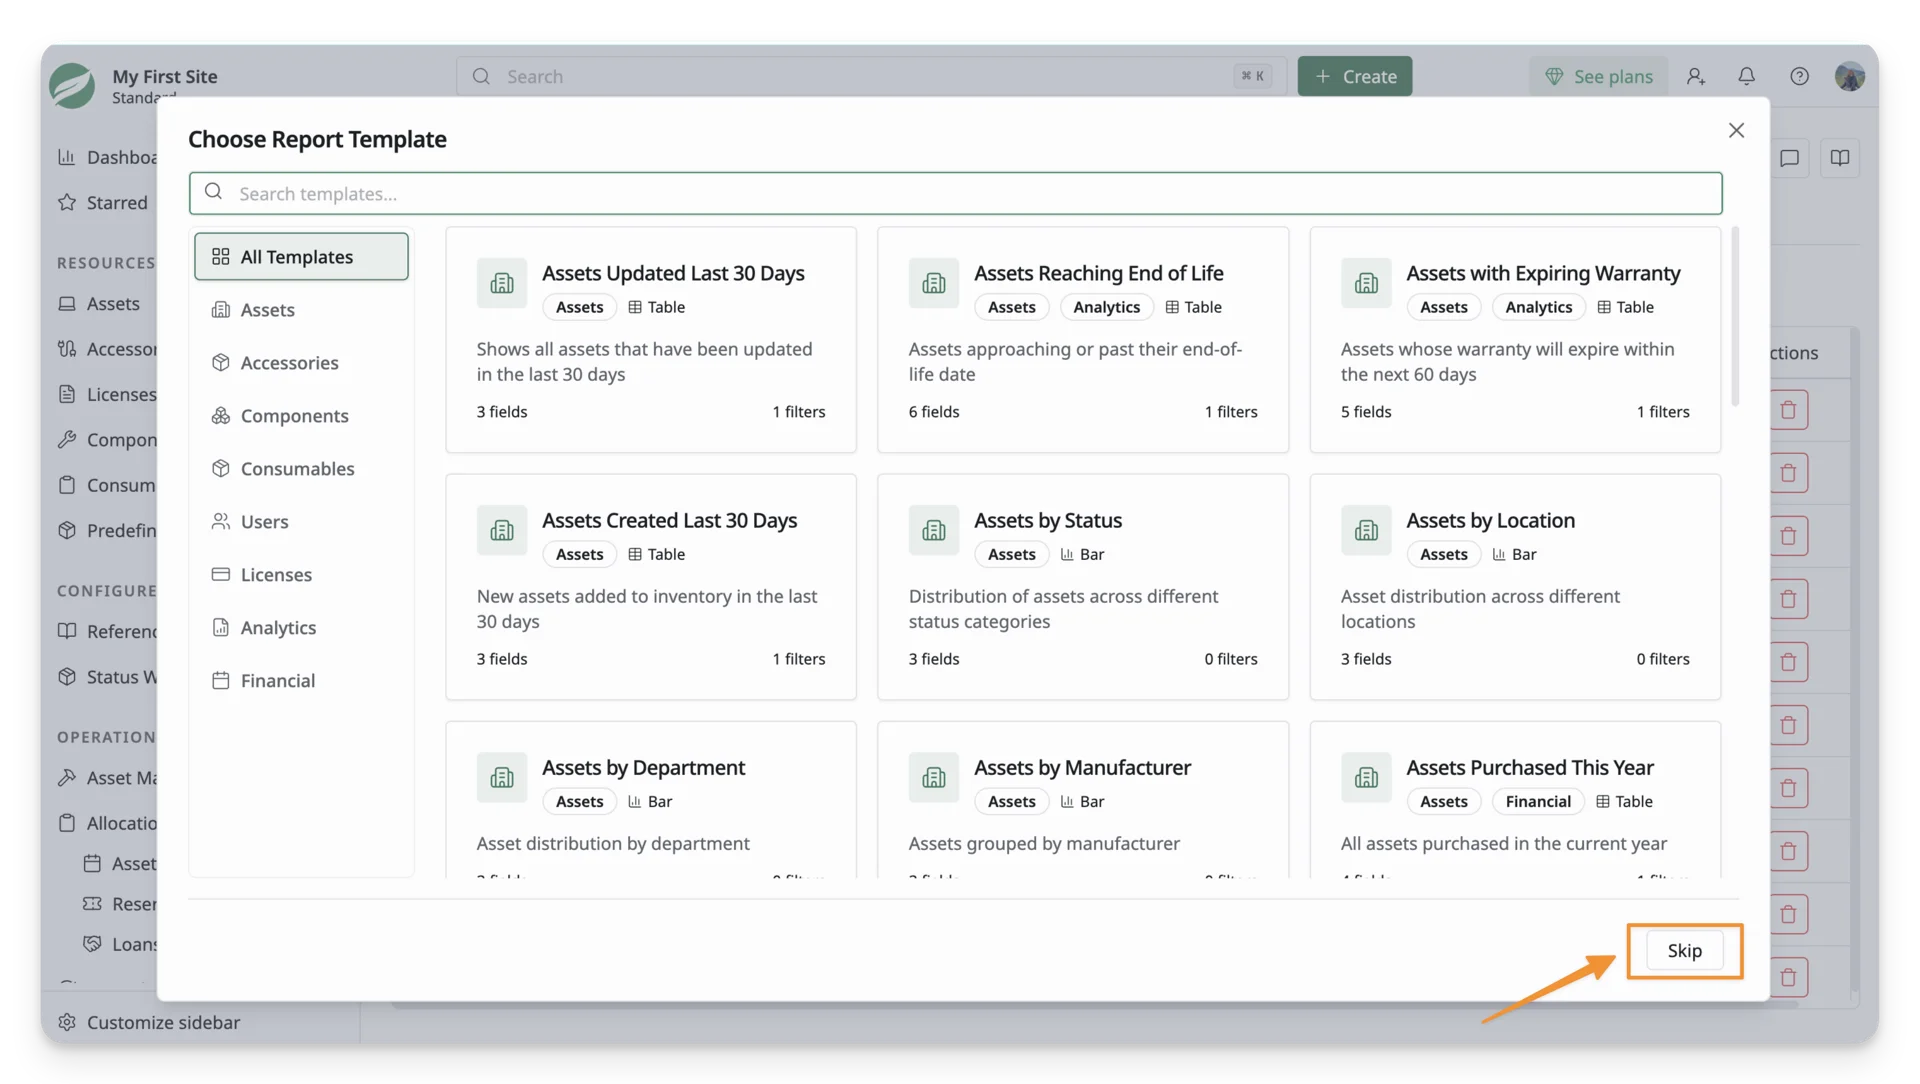
To create your own custom report, go to Analytics > Reports, click New Report, then select Skip in the template window. This takes you directly to the Report Builder screen.
Step 1: Add essential report information
Before configuring the report data, add the necessary information that helps you and your team understand what the report is for.
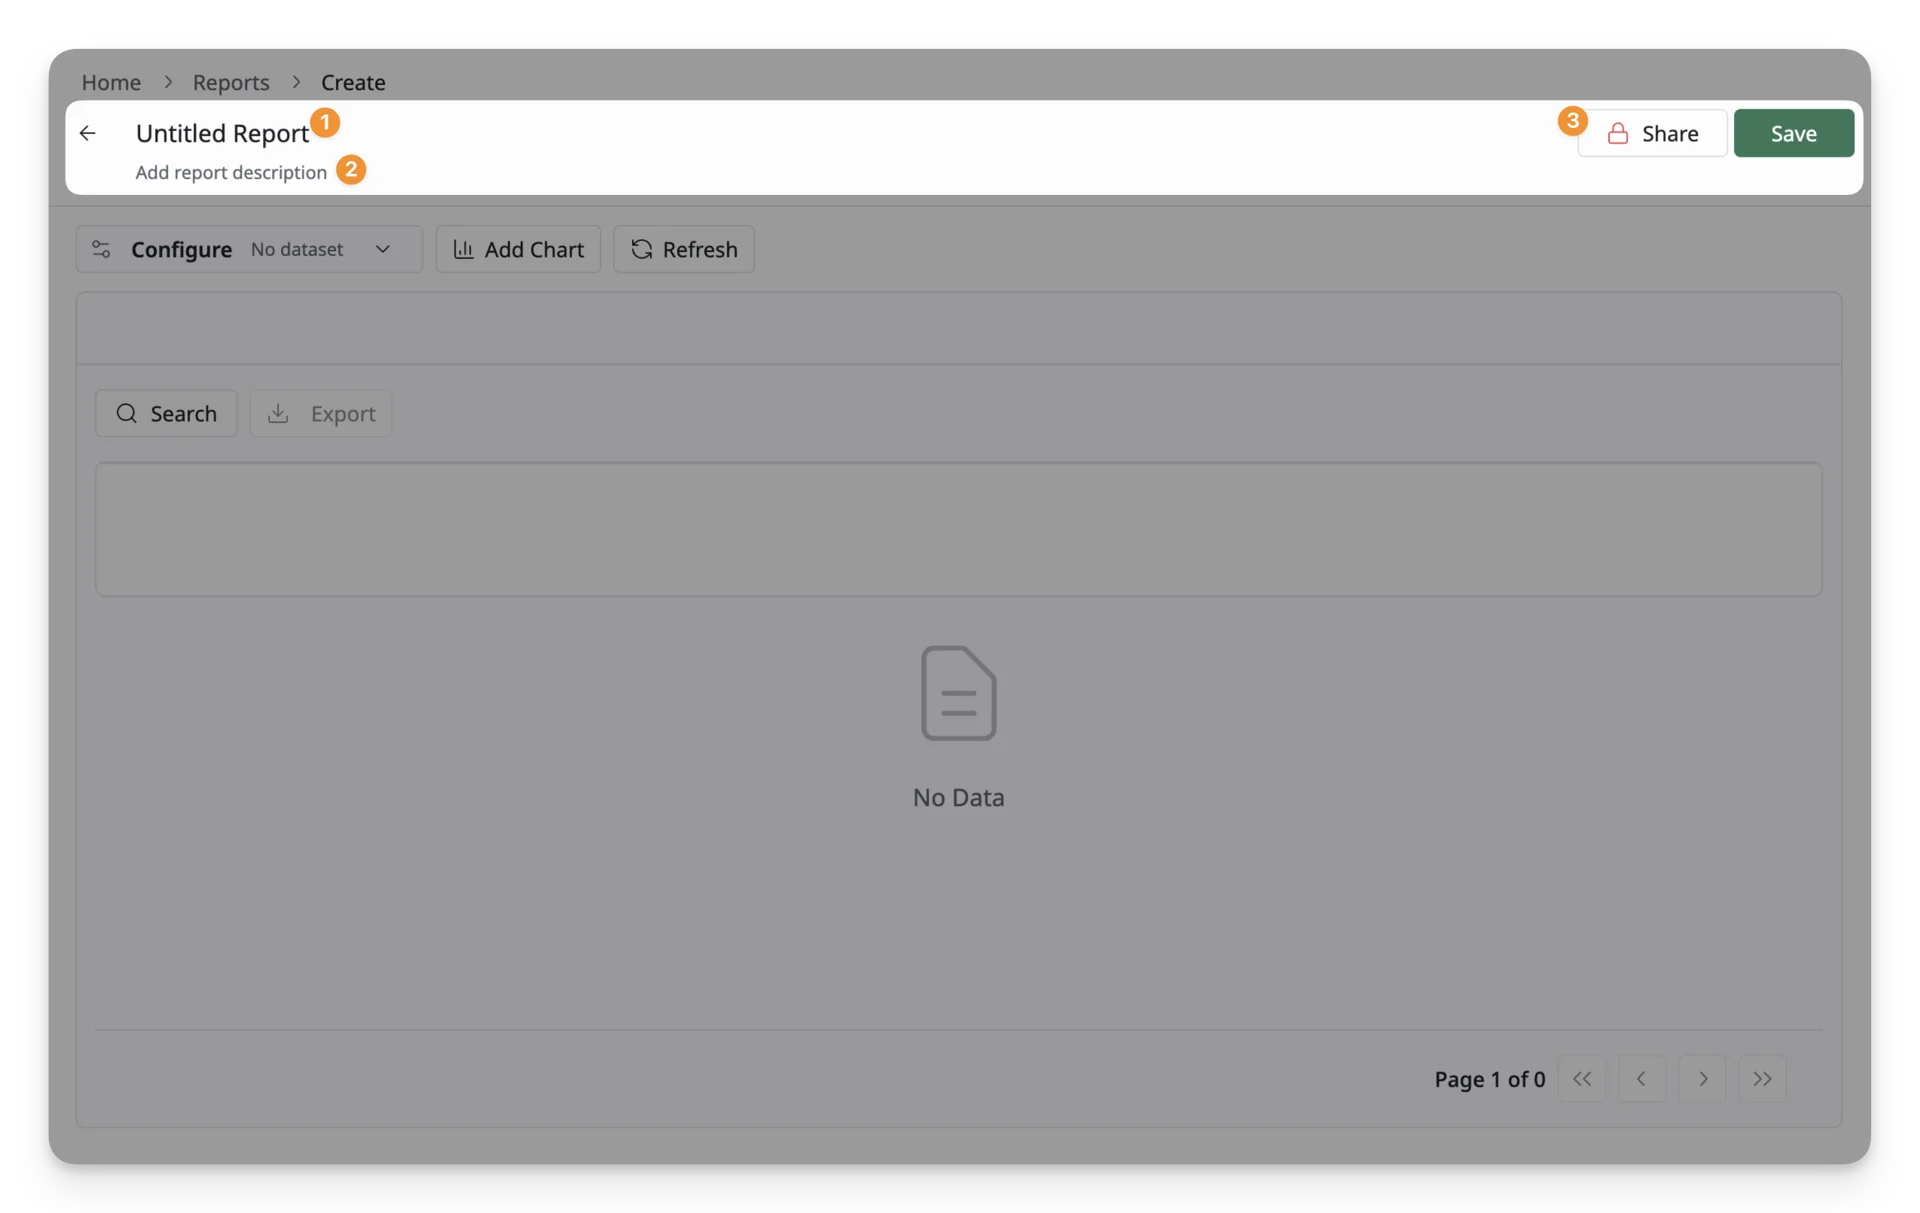
- Report name: Enter a clear name that makes the report easy to recognize, such as “Unassigned Assets” or “Licenses Expiring in 60 Days”.
- Report description: Add a short description explaining what the report shows.
- Visibility: Click Share to choose who can view the report.
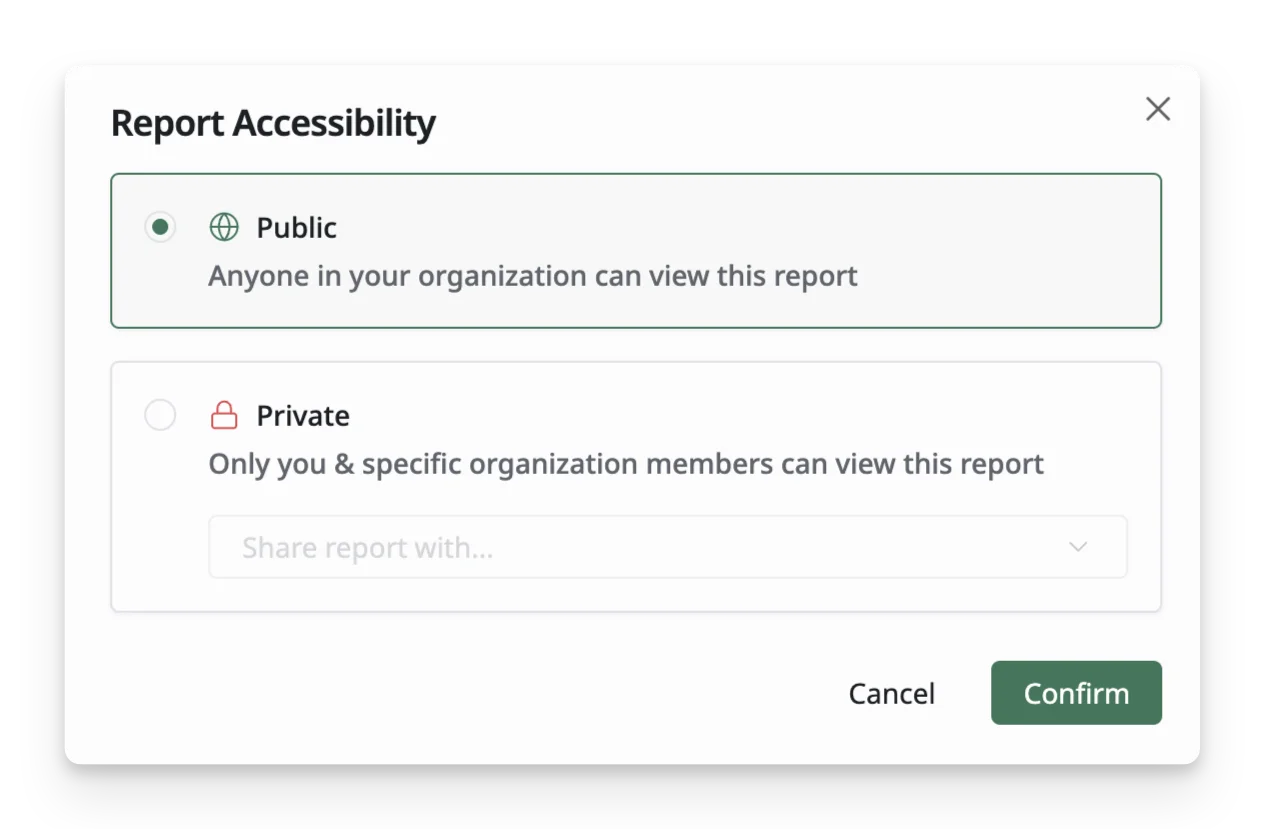
- Public: All site members with the required dataset permission can view this report.
- Private: Only you and selected members can view this report if they also have the required dataset permission.
Step 2: Configure the report dataset
After entering the basic report information, click Configure to specify which data the report should use. Here, you should see a dialog that lets you set up filters for your report, starting with:
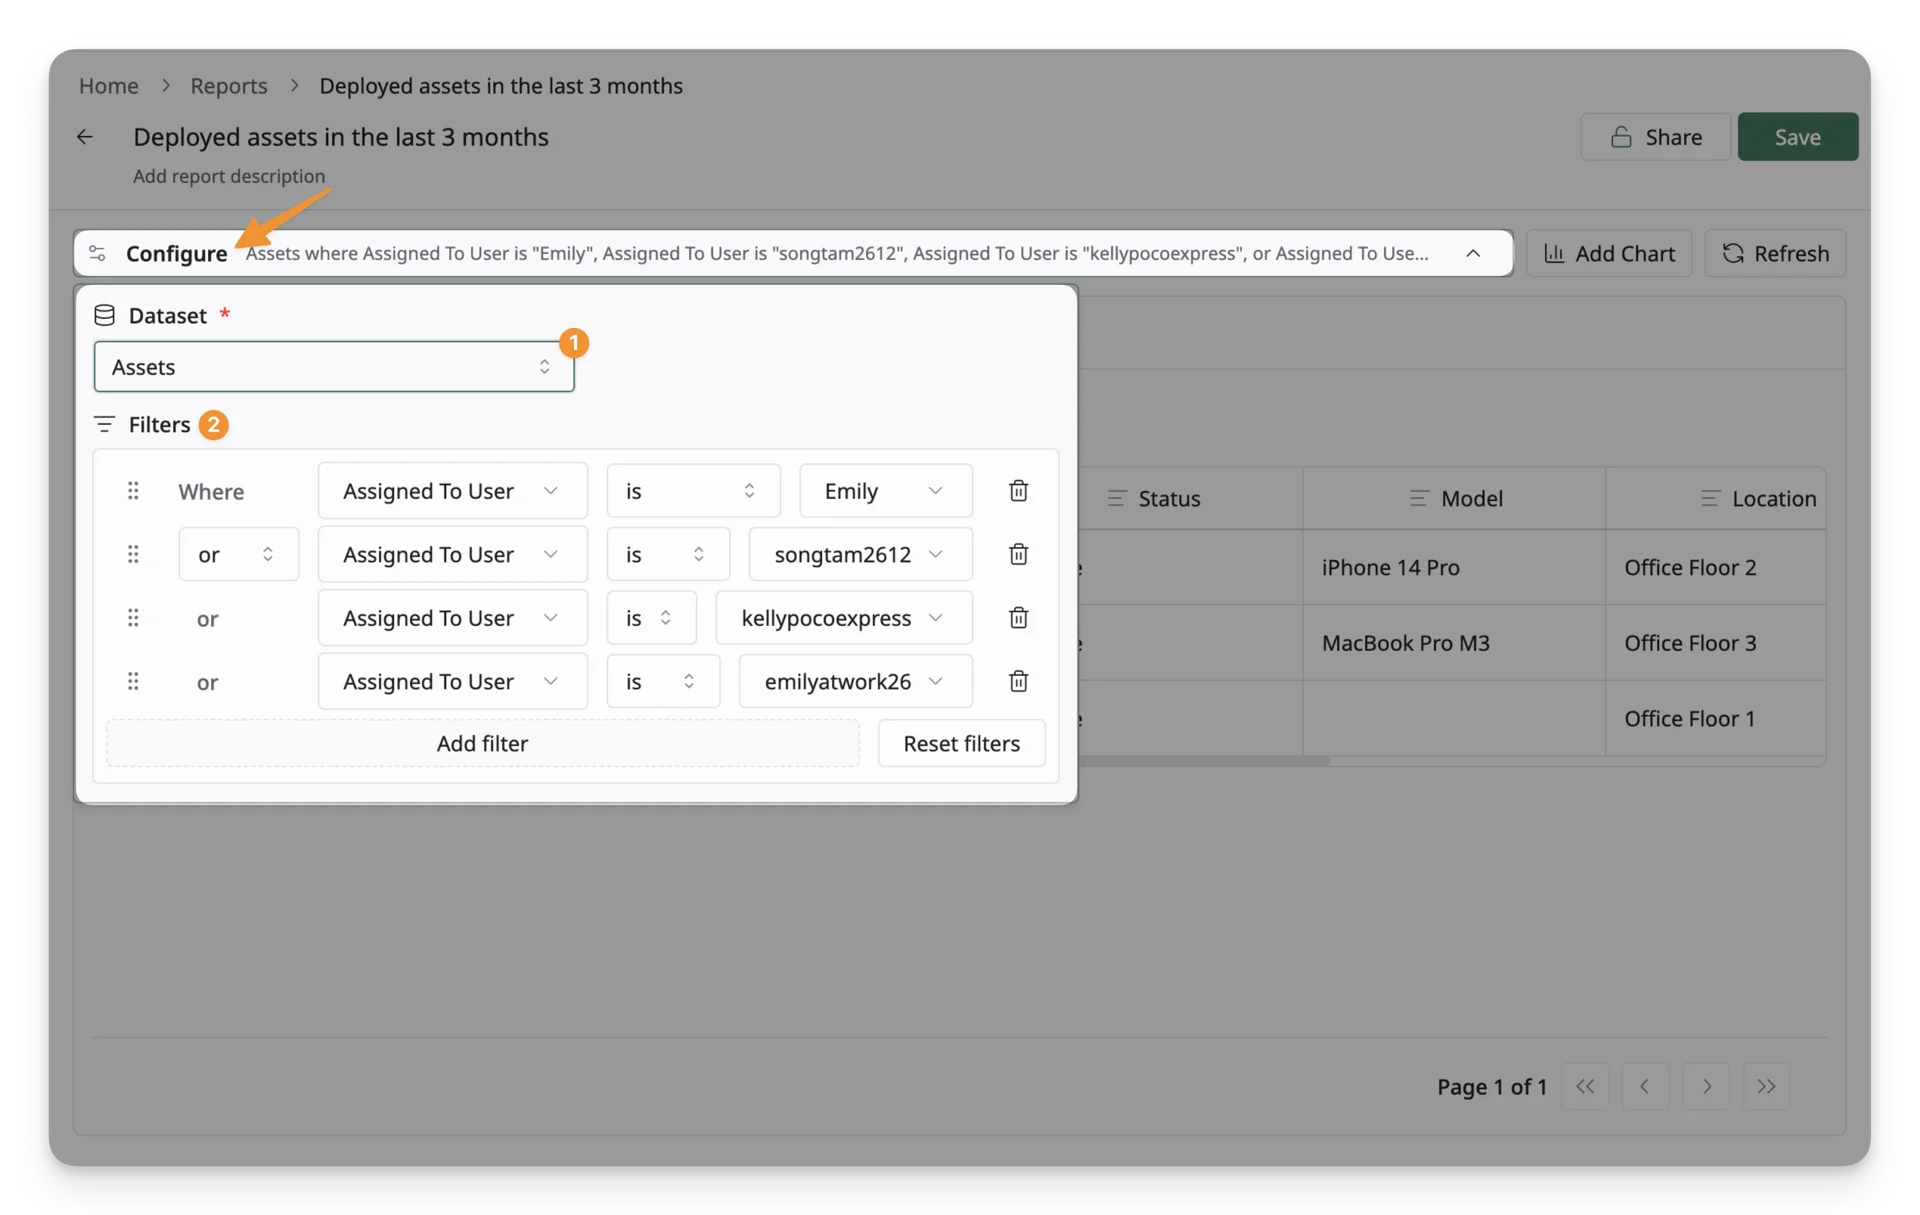
- Select a Dataset: Select the type of data you want to generate the report from. The selected dataset determines which records, fields, and filters are available in the report.
You can only create reports from datasets for which you have the required View permission.
- Add Filter: After selecting a dataset, AssetLoom shows the filters available for that dataset.
- Filters help narrow the report results so that it includes only records that match your conditions.
- You can add multiple filters and combine them with AND or OR, depending on how specific you want the report to be.
- Use AND when all conditions must be true.
- Use OR when any one of the conditions can be true.
Step 3: Generate the report
After selecting the dataset and setting the filters, click Regenerate Report. AssetLoom will run the report based on your selected dataset and filter conditions. The results will appear in the report table.
From here, you can adjust what information is shown, export the results, or add a chart to visualize the report data.
Choose fields to display
Click Fields to display to choose which fields appear in the report table. You can select fields you want to show or unselect fields you want to hide from the generated report.
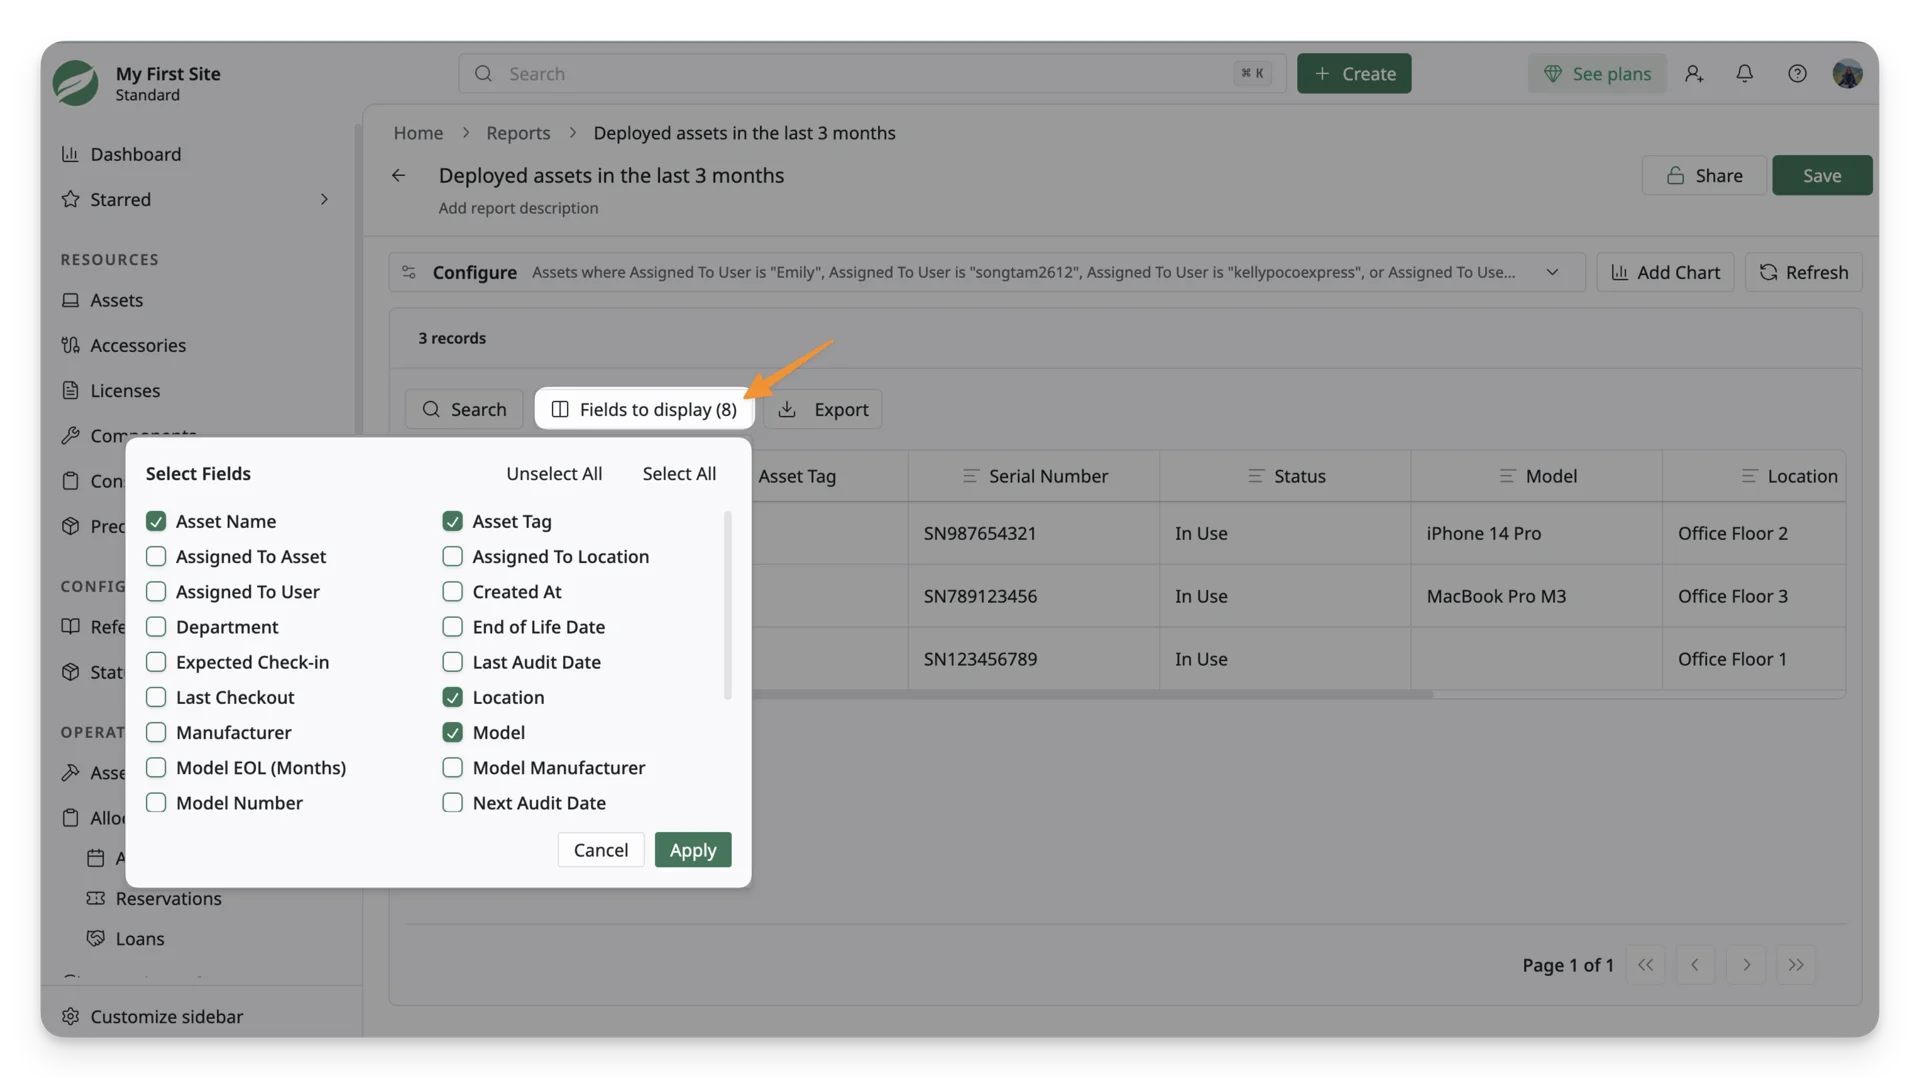
This is useful when you want the report to focus only on the most relevant information. For example, an asset report may show Asset Name, Asset Tag, Serial Number, Status, Model, and Location, while hiding fields that are not needed for the current review.
Export the report
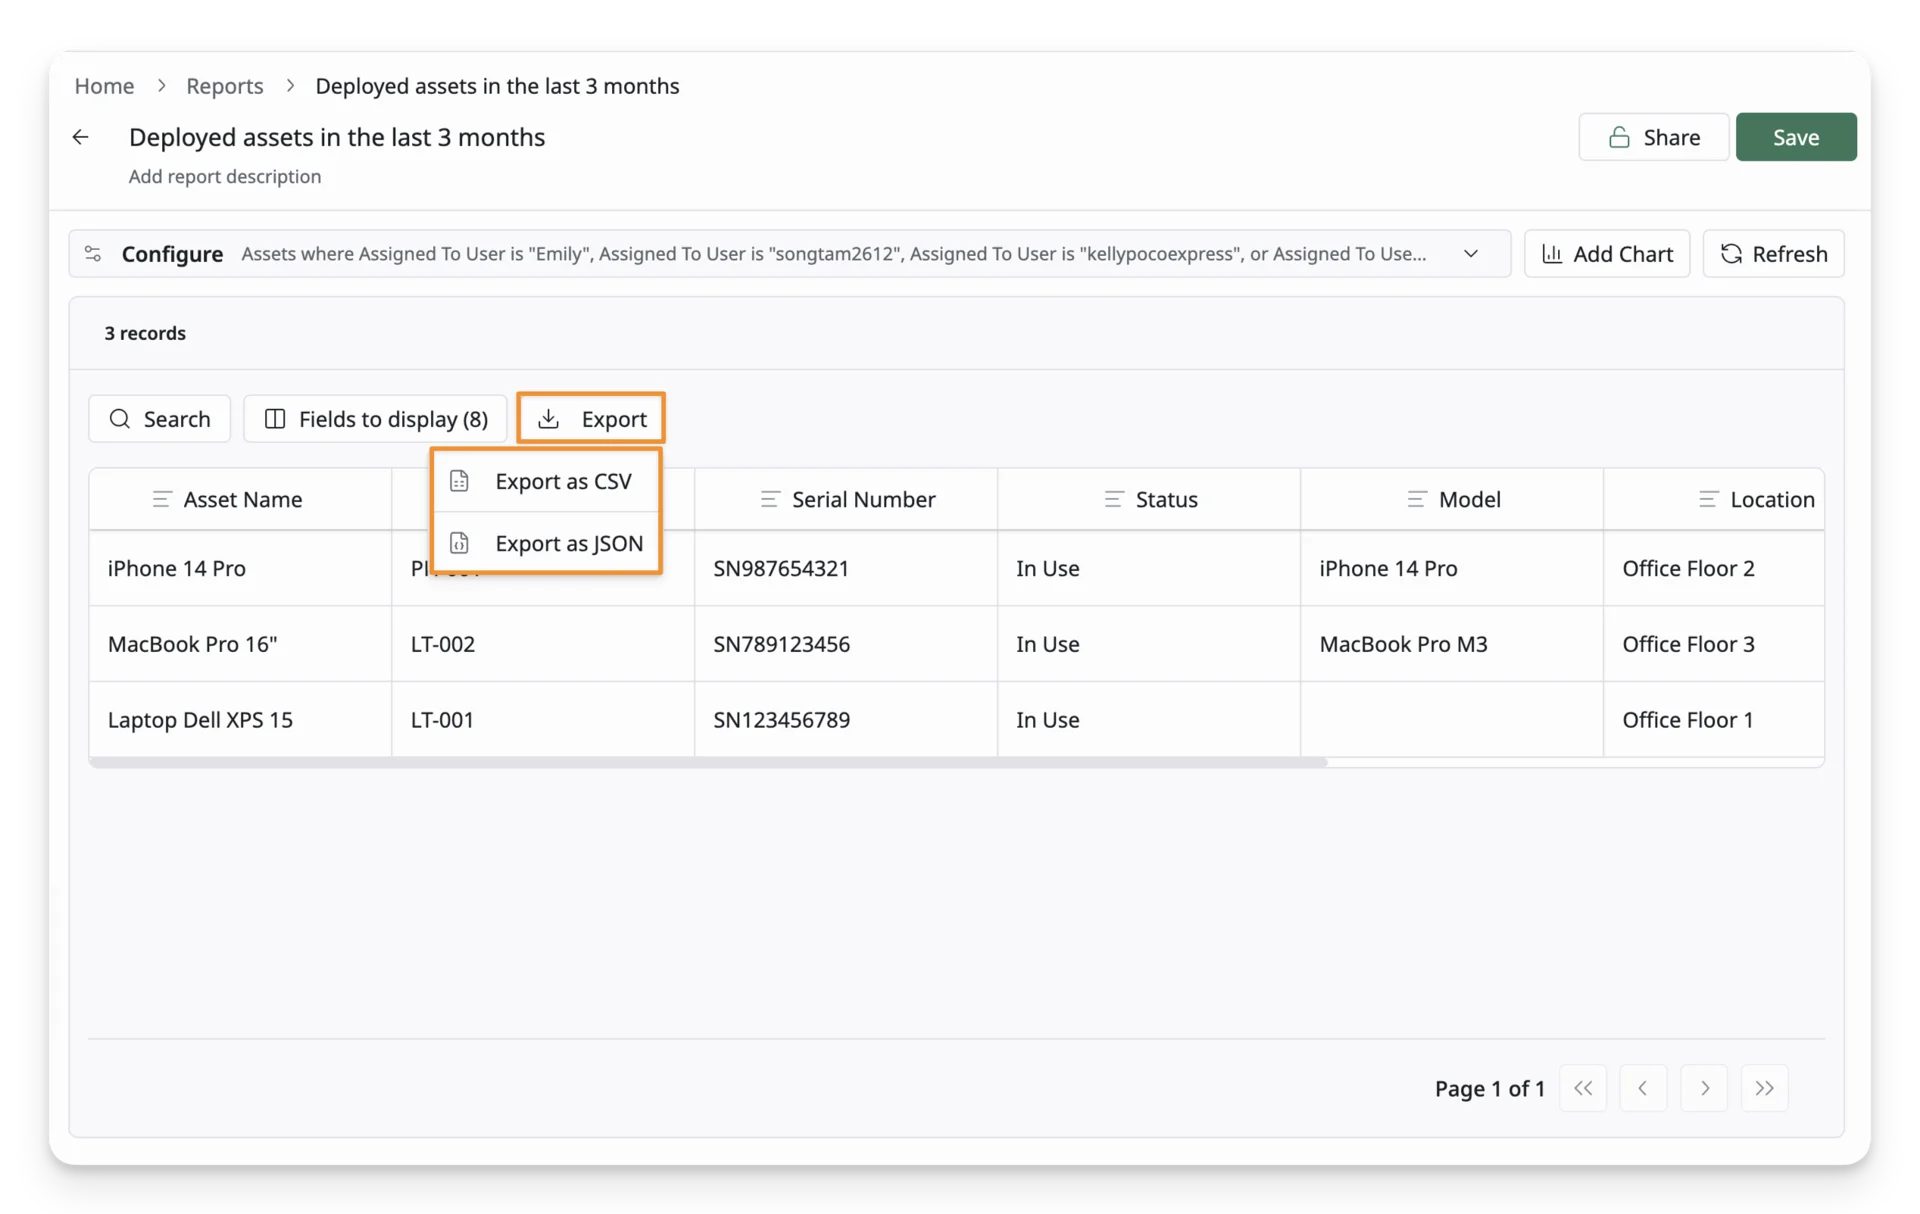
Click Export to download the report results. Reports can be exported as a or JSON file, depending on how you want to use the data.
Add a chart for your report
You can add a chart to visualize the report results and make the data easier to understand at a glance.
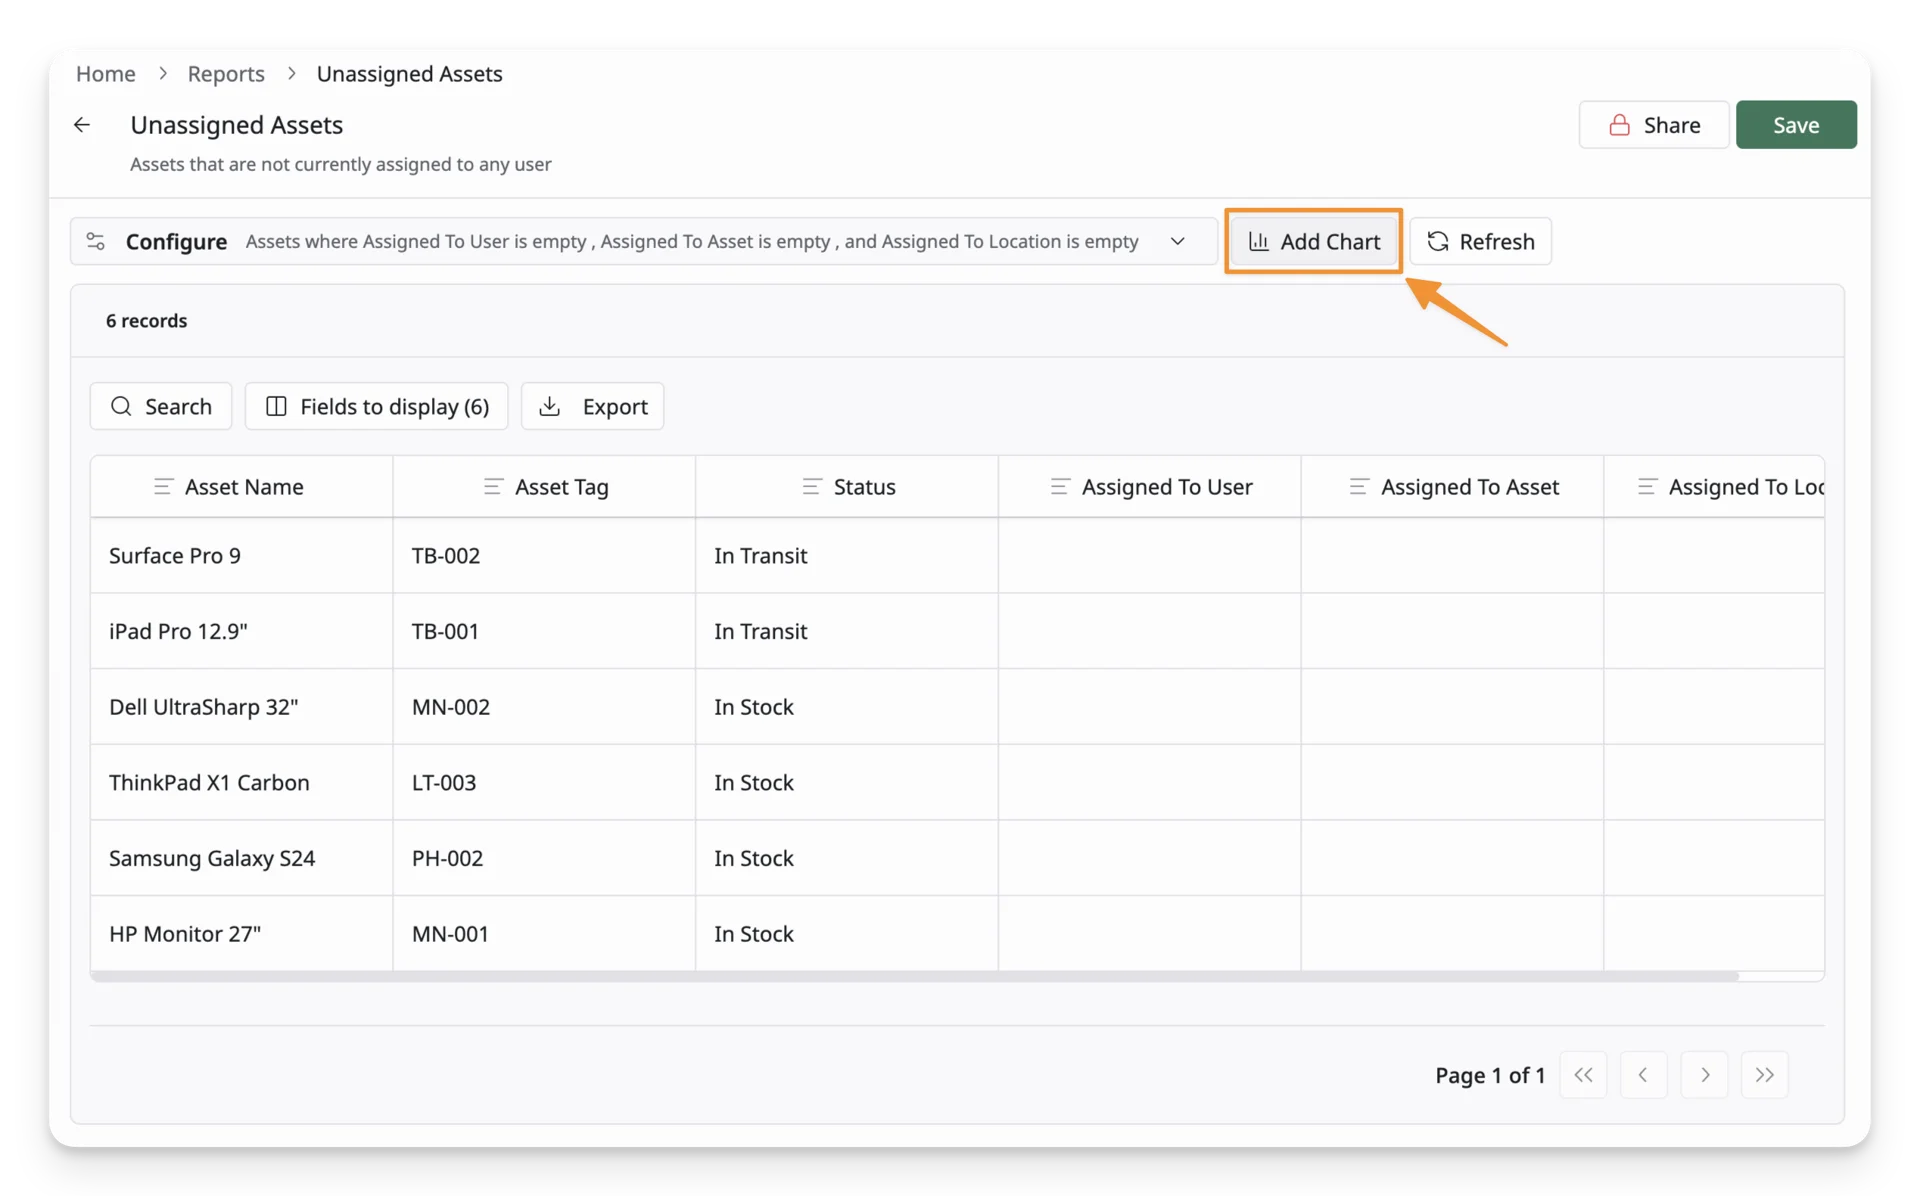
Charts are useful when you want to summarize patterns, compare groups, or show how records are distributed across categories. For example, you can use a chart to see how many assets are assigned to each user, how many licenses belong to each category, or how consumables are distributed by stock status.
Configure the chart
Click Add Chart to open the chart panel. The chart starts as Unconfigured until you choose how the data should be grouped and displayed.
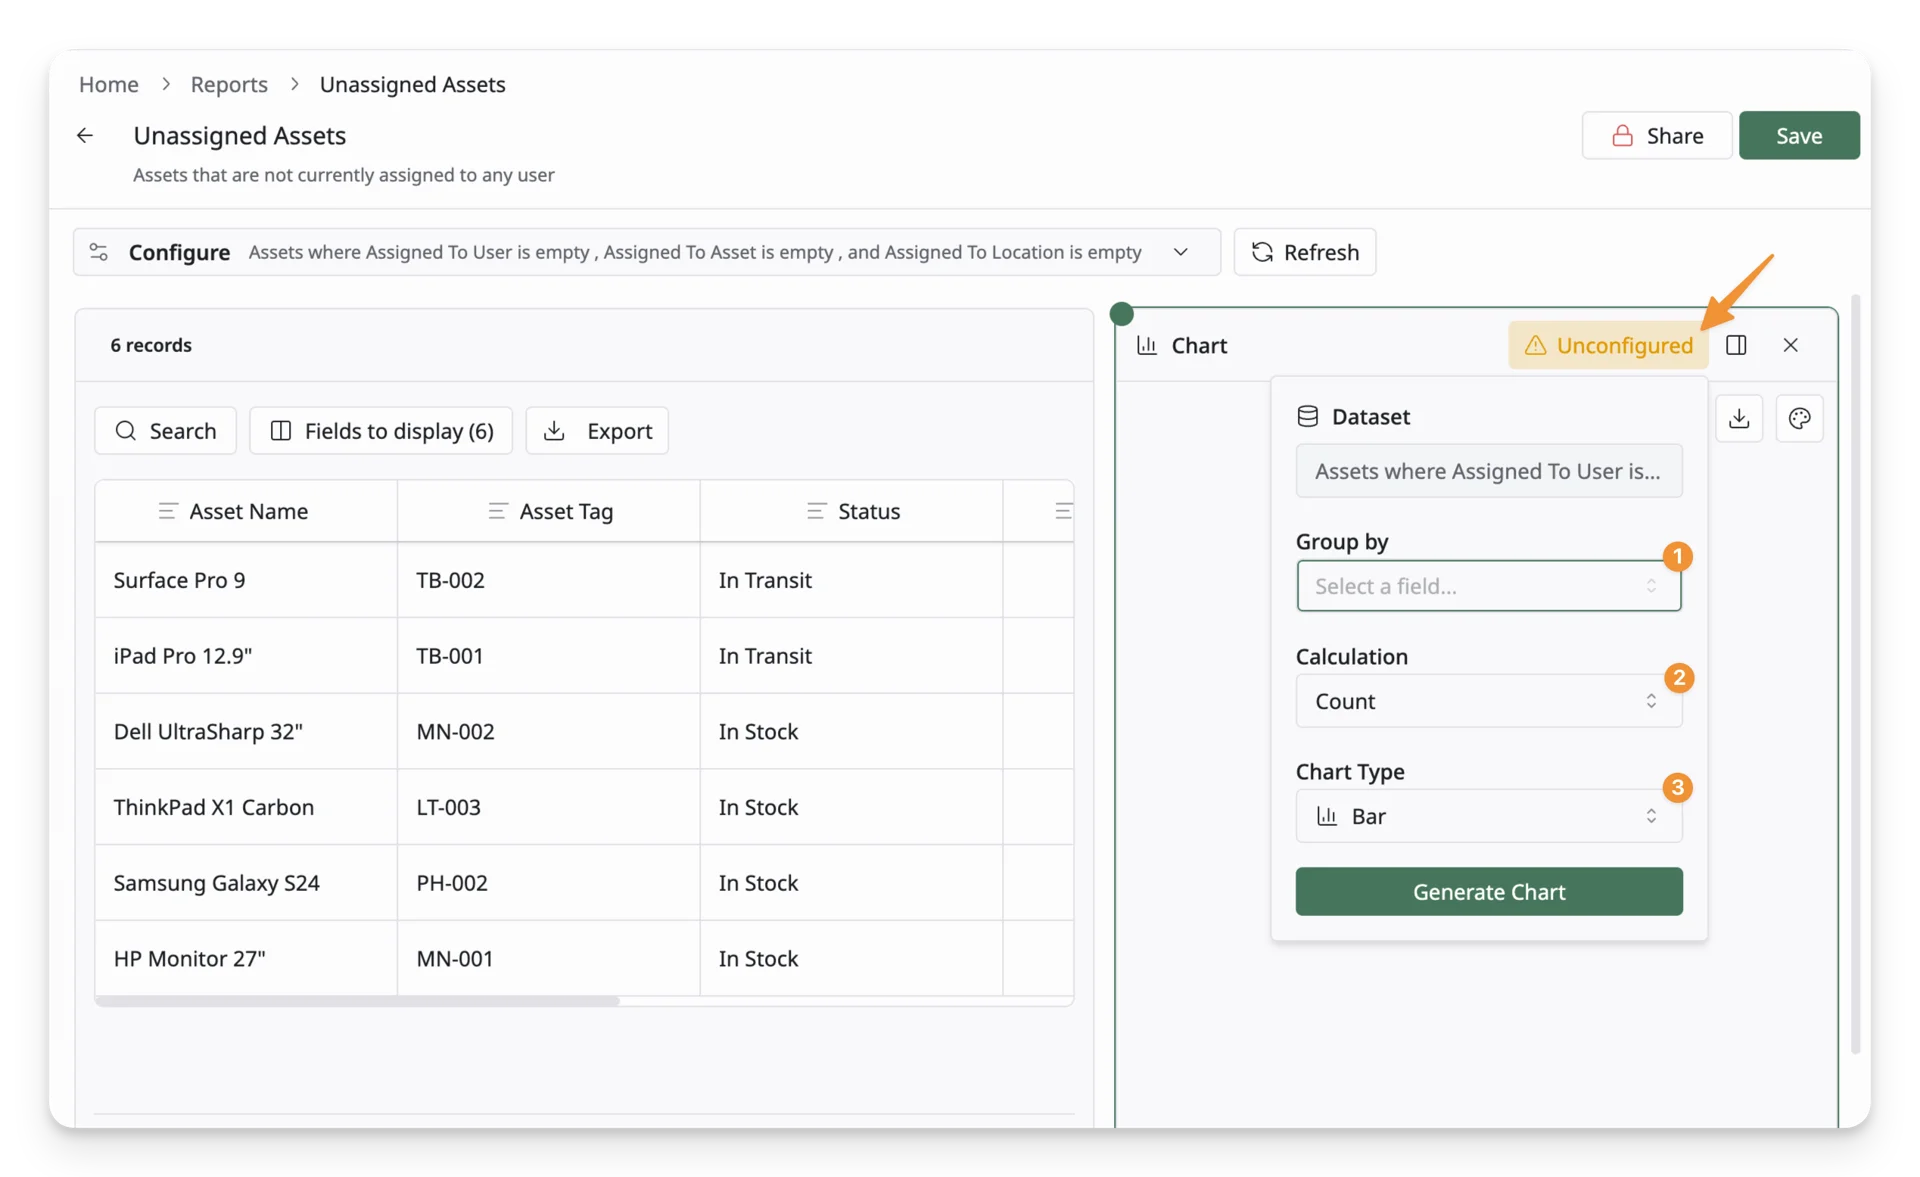
In the chart settings, choose:
- Dataset: Shows the dataset and filters already used by the report. This confirms which report data the chart will visualize.
- Group by: Select the field used to group the chart data. The field to select depends on the selected dataset in your generated report.
- Calculation: Choose how values should be calculated.
- Count: Counts the number of records in each group.
- Sum: Adds values together.
- Average: Shows the average value.
- Minimum: Shows the lowest value.
- Maximum: Shows the highest value.
- Chart Type: Choose how the chart should be displayed.
- Bar: Useful for comparing values across categories.
- Line: Useful for showing changes or trends.
- Area: Useful for showing volume or trend emphasis.
- Pie: Useful for showing proportional distribution.
After selecting the chart settings, click Generate Chart. You should now see a chart next to your generated report. You can modify the configuration anytime at Chart Settings.
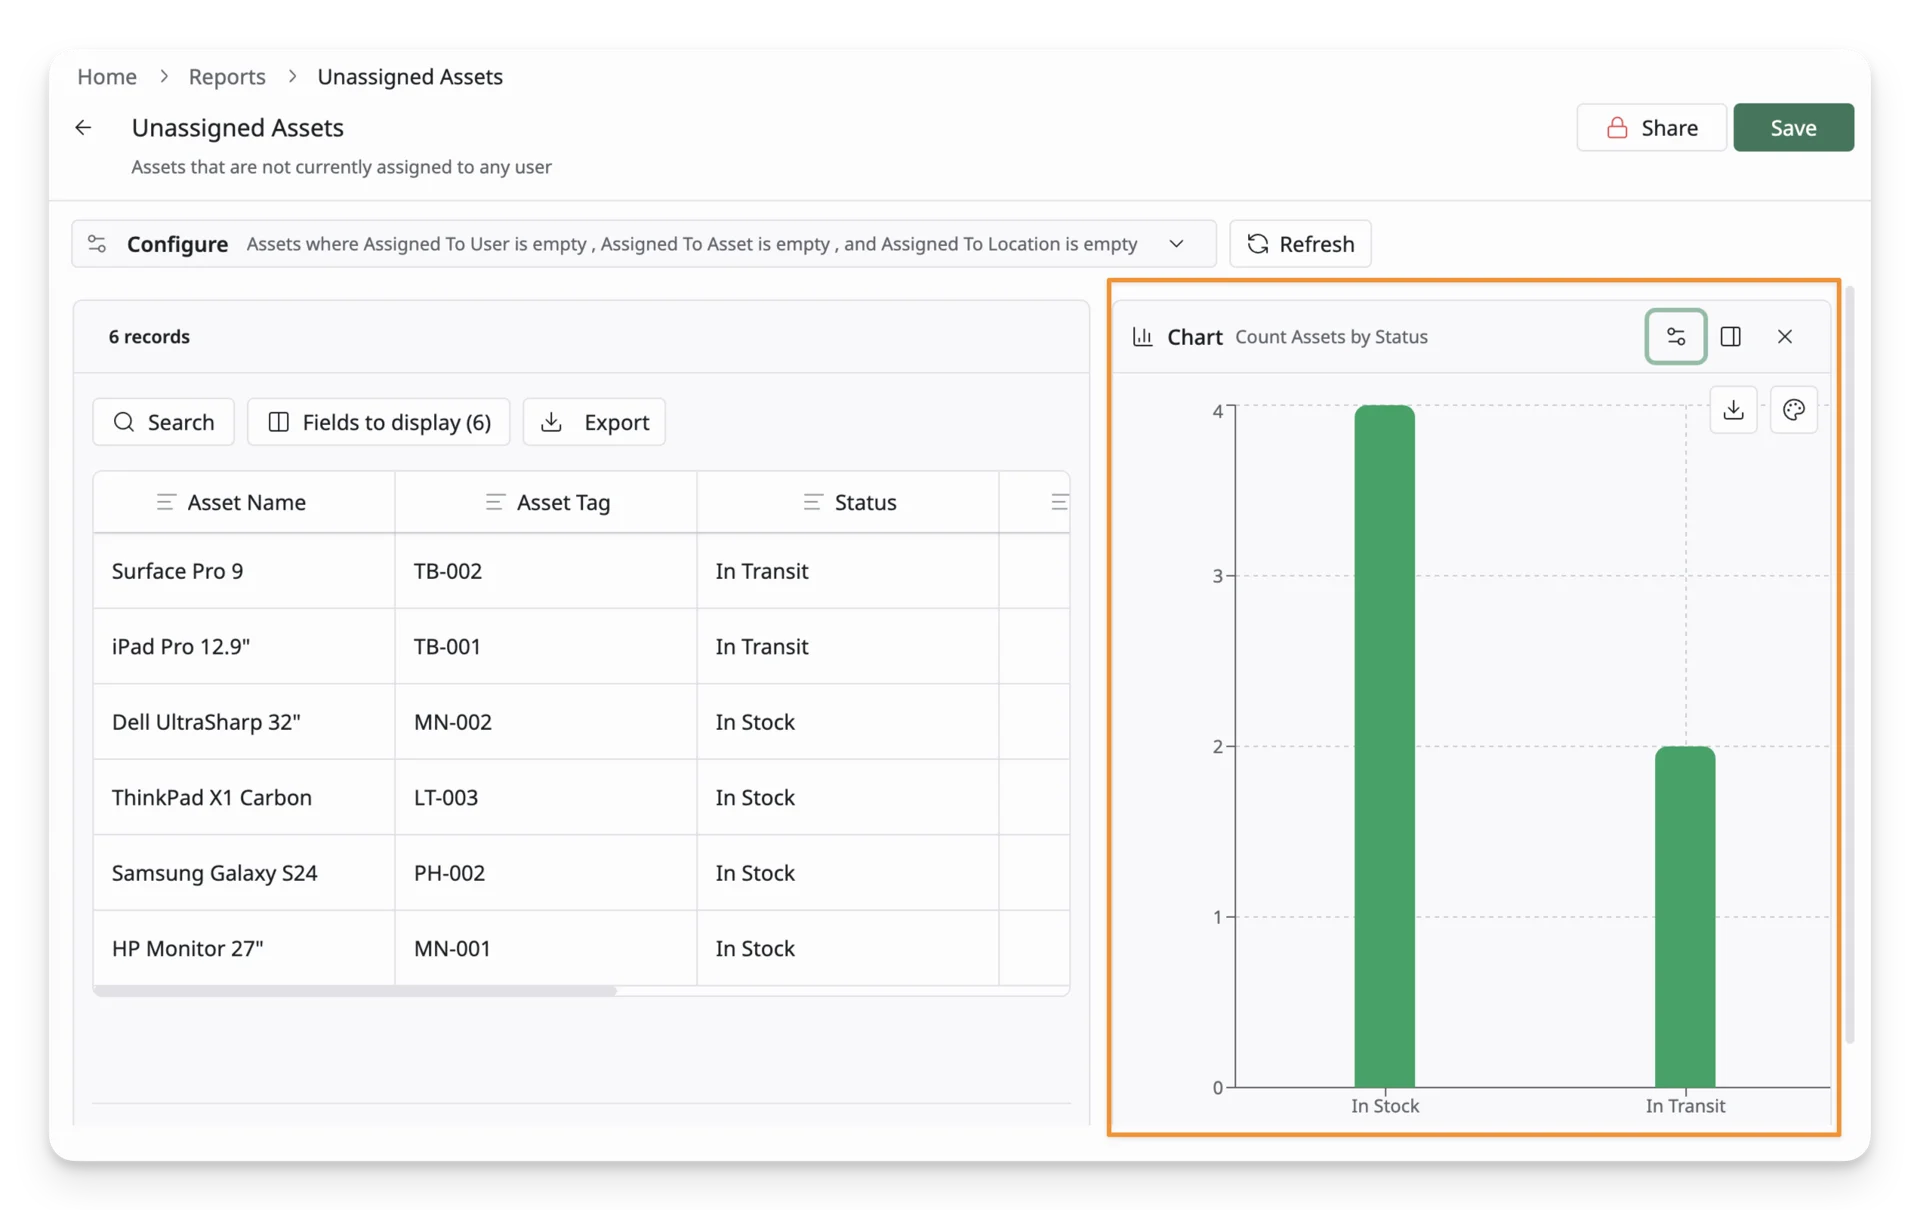
Customize the chart appearance
After the chart is generated, you can adjust how it looks and where it appears by clicking Chart Preferences.
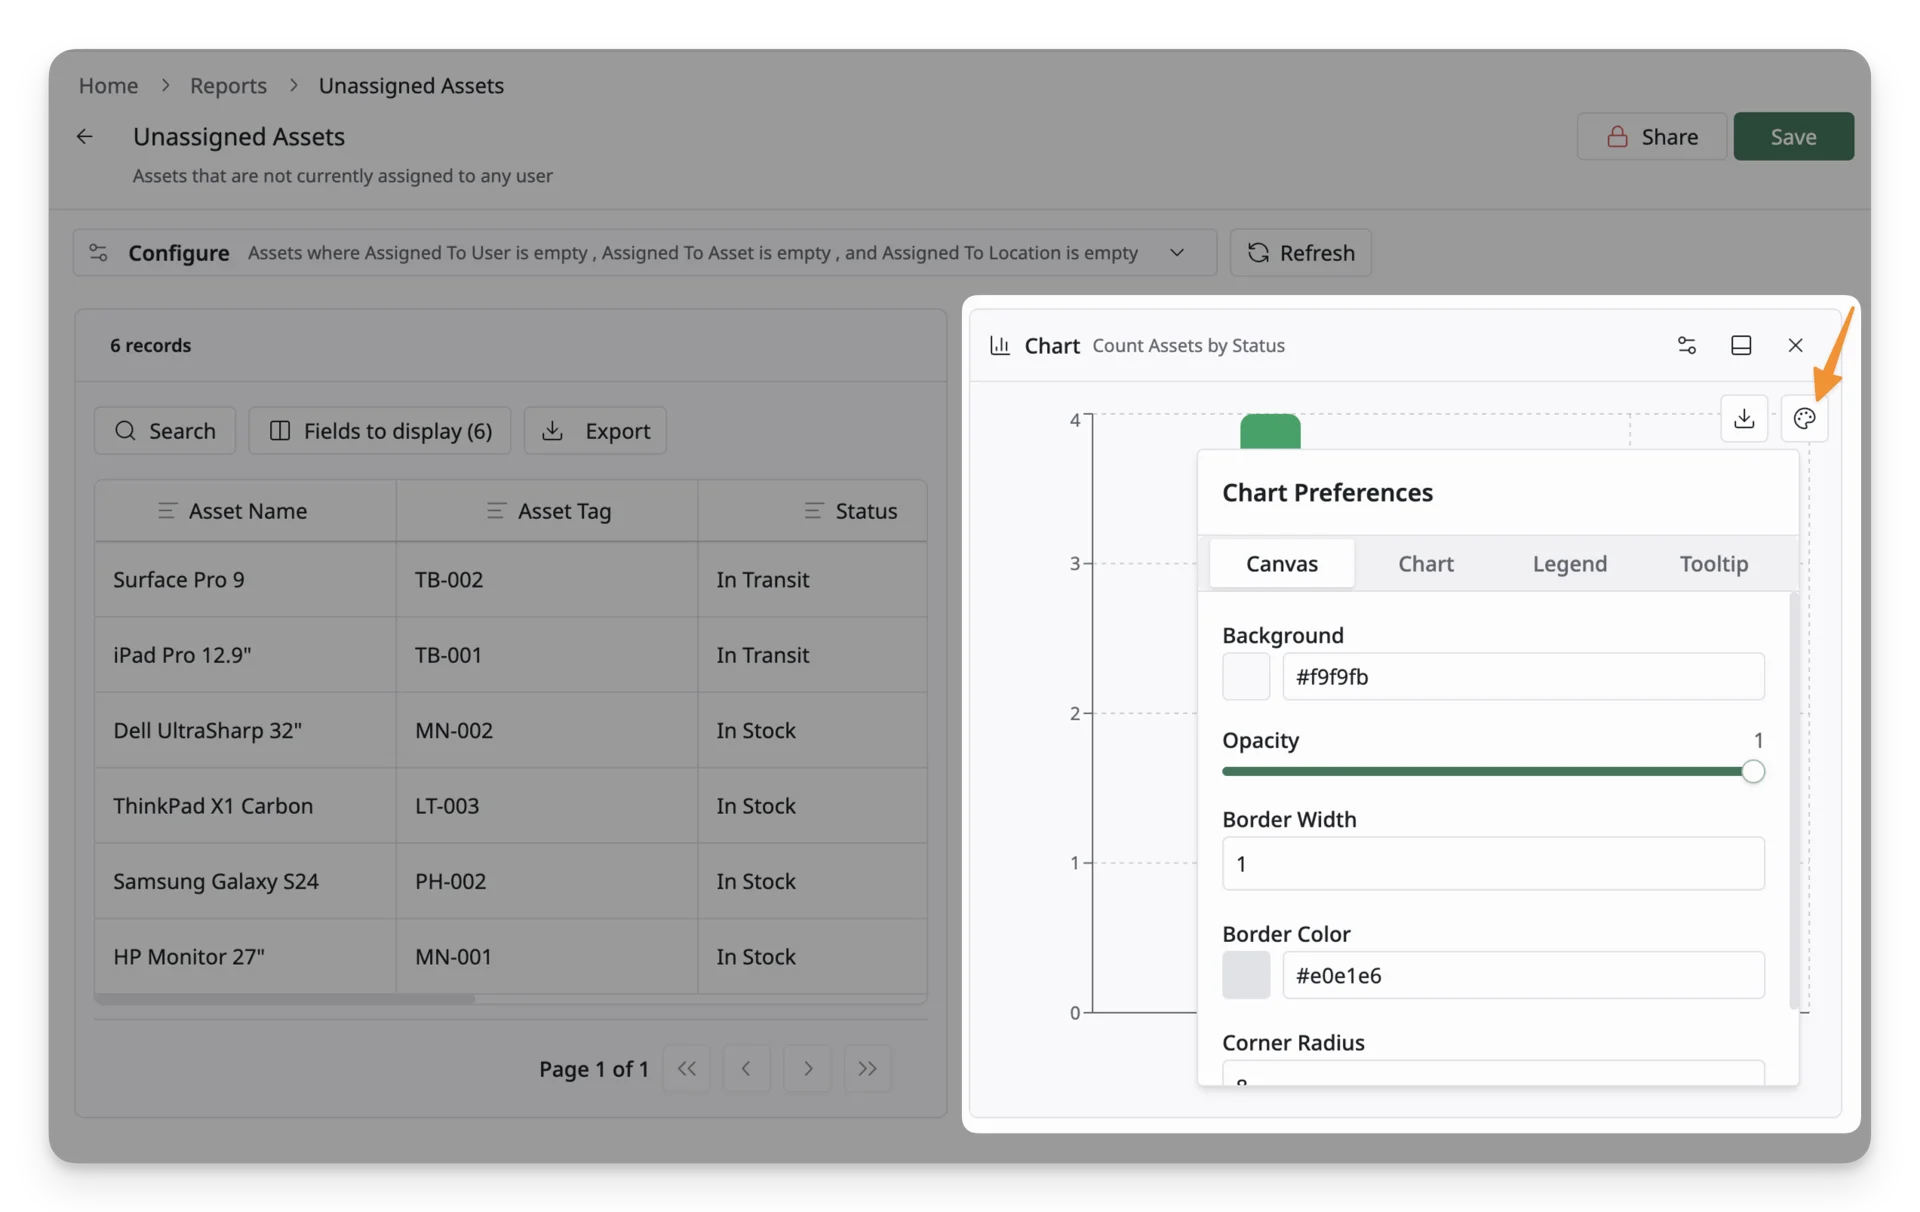
- Chart Preferences: Customize the visual style of the chart, including canvas, chart, legend, and tooltip settings.
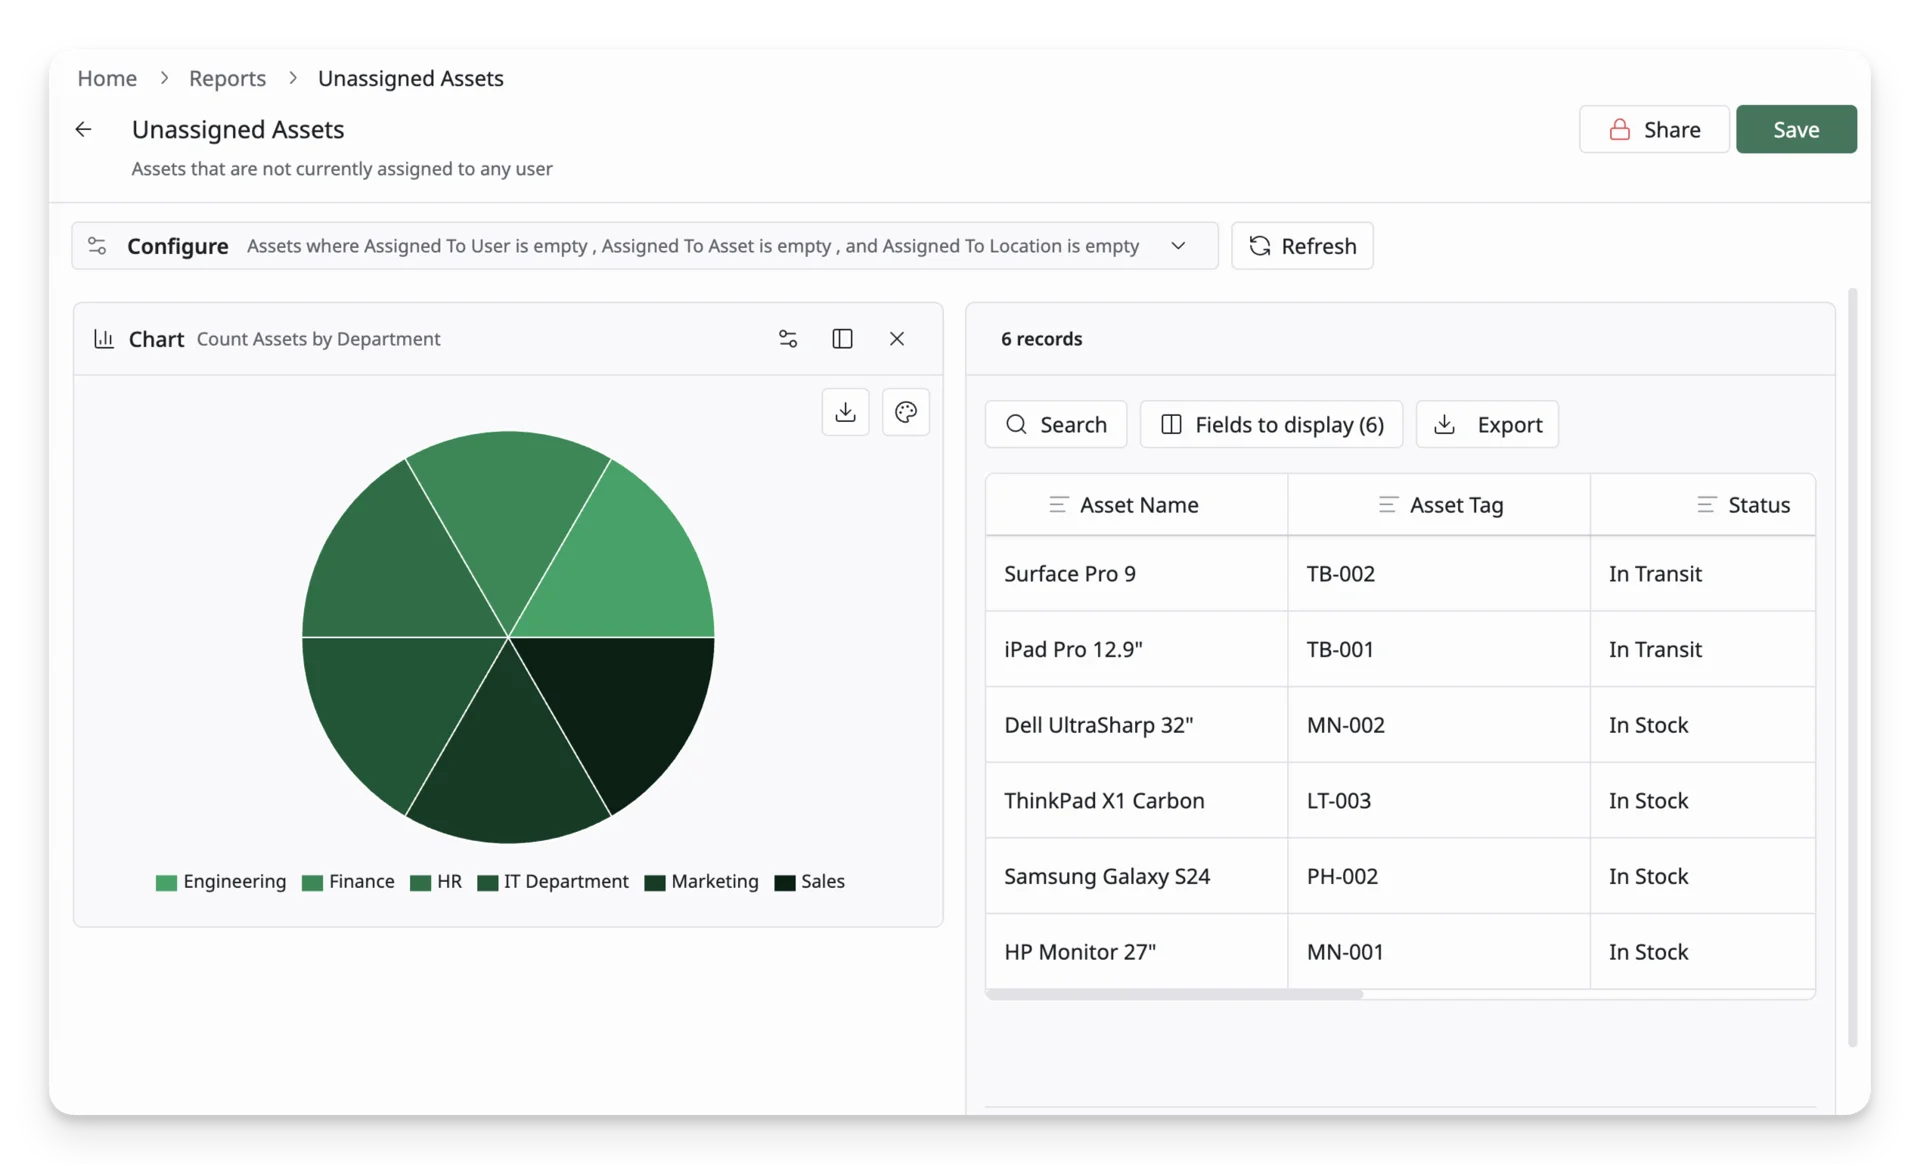
- Chart Position: Choose where the chart appears in relation to the report table: Above, Below, Left, or Right. You can resize it by dragging the edge of the chart panel to create the layout that works best for your report.
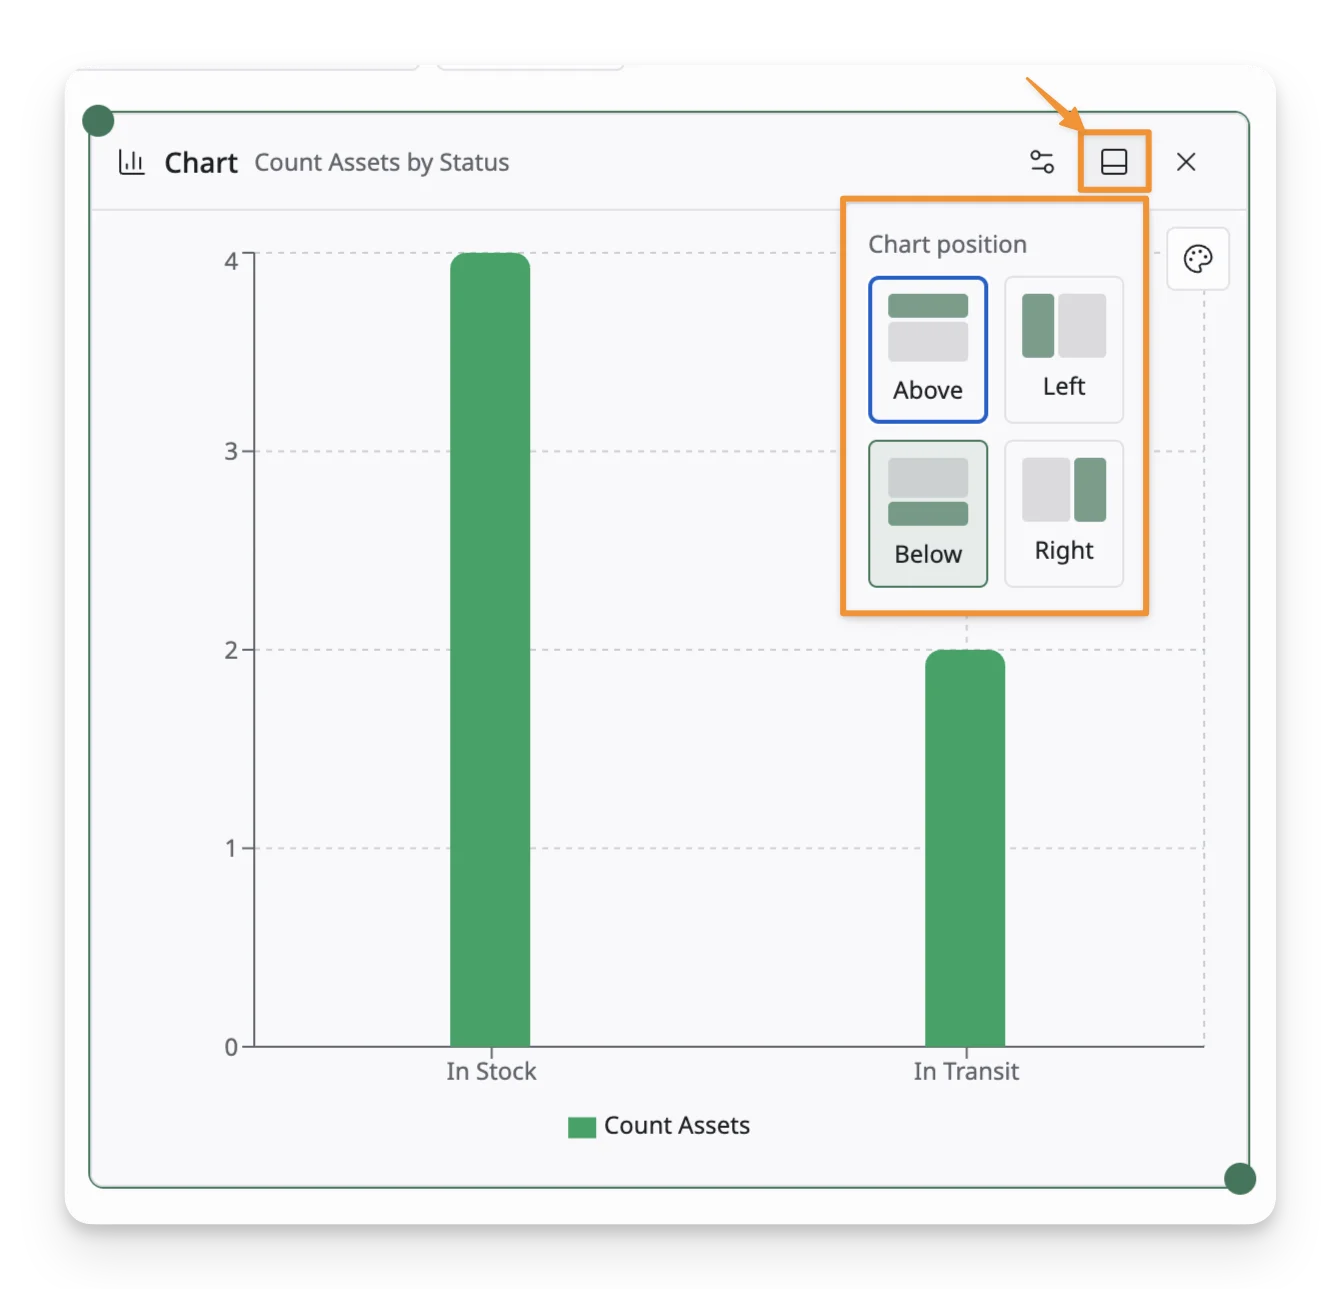
- Download chart: Export the chart as an image file or PDF file for sharing or documentation.
When you are done, click Save to keep the chart configuration with the report.
Step 4: Save the report
When you are satisfied with the report setup, click Save. Saving the report keeps the report name, description, visibility setting, selected dataset, filters, displayed fields, and chart configuration so you can reuse it later.
What’s Next?
- Types of Widgets: Understand the available AssetLoom widgets
- Set Up A Personalized Dashboard: Explore how to set up a personalize dashboard